Plastic Deformation and Strengthening
advertisement
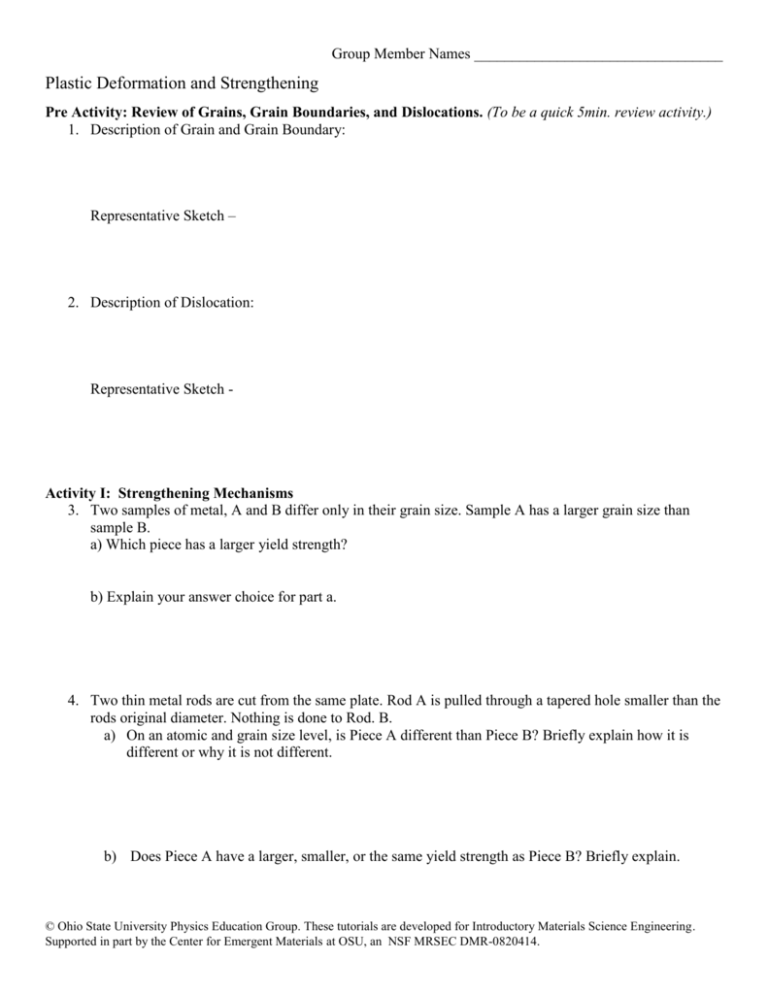
Group Member Names _________________________________ Plastic Deformation and Strengthening Pre Activity: Review of Grains, Grain Boundaries, and Dislocations. (To be a quick 5min. review activity.) 1. Description of Grain and Grain Boundary: Representative Sketch – 2. Description of Dislocation: Representative Sketch - Activity I: Strengthening Mechanisms 3. Two samples of metal, A and B differ only in their grain size. Sample A has a larger grain size than sample B. a) Which piece has a larger yield strength? b) Explain your answer choice for part a. 4. Two thin metal rods are cut from the same plate. Rod A is pulled through a tapered hole smaller than the rods original diameter. Nothing is done to Rod. B. a) On an atomic and grain size level, is Piece A different than Piece B? Briefly explain how it is different or why it is not different. b) Does Piece A have a larger, smaller, or the same yield strength as Piece B? Briefly explain. © Ohio State University Physics Education Group. These tutorials are developed for Introductory Materials Science Engineering. Supported in part by the Center for Emergent Materials at OSU, an NSF MRSEC DMR-0820414. 5. Pure Copper has a yield strength of about 70 MPa and pure Aluminum has a yield strength of about 35 MPa. Will a Copper-Aluminum alloy of 5% wt Al have a yield strength that is less than or more than 70 MPa? Explain. Activity II: Strain Hardening and Cold Working C Engineering Stress B A Strain 6. Draw on the graph what would happen if you release the stress at point B and then reapplied stress until the rod breaks. 7. Imagine placing a rod under tensile stress until it reaches point B, and then releasing the tension. Does the rod now have a lower, equal, or greater yield strength than before it was placed under tension? Explain. © Ohio State University Physics Education Group. These tutorials are developed for Introductory Materials Science Engineering. Supported in part by the Center for Emergent Materials at OSU, an NSF MRSEC DMR-0820414. 8. Five pieces of metal are cut from the same plate. One of the pieces is put under tension until it breaks, and its true stress strain curve is plotted below. The other four pieces are put under incrementally increasing amounts of plastic strain before being released from tension. (The second piece is put under tension until it is at 5% plastic elongation and then the tension is released. The third piece is put under tension until it is at 10% plastic elongation and then the tension is released…..) Using the true stress stain curve calculate the new yield strength and ductility for each of the 4 worked pieces. Then plot them on the graphs provided below. True Stress 300 MPa 200 MPa 100 MPa 0 0.05 0.1 0.15 0.2 0.25 0.3 Ductility Yield Strength Strain % CW % CW © Ohio State University Physics Education Group. These tutorials are developed for Introductory Materials Science Engineering. Supported in part by the Center for Emergent Materials at OSU, an NSF MRSEC DMR-0820414. Activity III: Looking Forward 9. These activities suggest that when we work a piece of metal it gets stronger. However, you also know that stress on metal over time can cause the metal to break and therefore the stress must have “weakened” the metal. Talk with your group members and try to come up with a few possible reasons to explain this discrepancy. (You will learn more about how parts can fail like this next week!) Activity IV: Looking Backward 10. Student B says: “The stronger a metal is the greater its yield strength and the more force you must apply to it before it permanently deforms.” Circle: Correct Incorrect Explain: © Ohio State University Physics Education Group. These tutorials are developed for Introductory Materials Science Engineering. Supported in part by the Center for Emergent Materials at OSU, an NSF MRSEC DMR-0820414.
