Additional file 1 Figure captions Figure S1 Number of reads by
advertisement
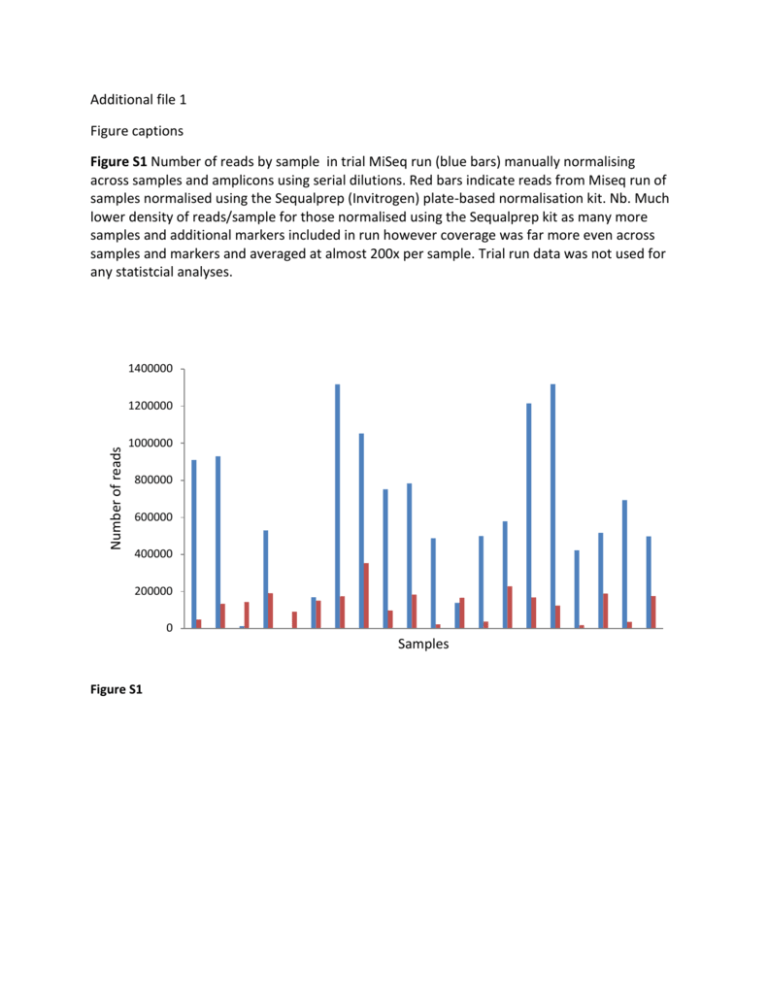
Additional file 1 Figure captions Figure S1 Number of reads by sample in trial MiSeq run (blue bars) manually normalising across samples and amplicons using serial dilutions. Red bars indicate reads from Miseq run of samples normalised using the Sequalprep (Invitrogen) plate-based normalisation kit. Nb. Much lower density of reads/sample for those normalised using the Sequalprep kit as many more samples and additional markers included in run however coverage was far more even across samples and markers and averaged at almost 200x per sample. Trial run data was not used for any statistcial analyses. 1400000 Number of reads 1200000 1000000 800000 600000 400000 200000 0 Samples Figure S1 Table S1 Amplicon characteristics and primer details for putatively neutral loci. Amplicon Length No. Primer sequence (5’-3’) (bp) SNPs ERN2 10165 UNC13B NF2 PLEK AGA DRD5 RAB* KIT* FOX* 9687 9312 10034 9352 7885 10077 8356 10122 17 14 41 16 34 1 2 2 39 TTTCCCCCAATCTGTTCCTA TTGCCCTTTCTAATCCCTGA GCATCCTGAGCAACCAAACT TGAGTTAGCACCCTCGATACC CATCCAGGTCAATCCCTGAA TGCTGAGAAGAGCAAGAGCTAA TCTGATAGAGAAGGGATTATTAGGAG AAGGAGCCCAGCTGAAGTTA TAGGTCCGATCAAAGGCAAC GGGCAGGGAGACTCTCAATTA GATTTTGCCACTGTGGGTCT TCCCCCTGACAGTCCACTAC GCAGTTATTACAAGTCATTTTGCCTA CCCTAAAGCATTGTATCCTTGC GCCTTGGAGATAATATGTGATTTG TTCTCTGCCTCCTGATCCTG TTGGTCCCAGTCCATTTCAT ATTTGAGGGAAGTGCTGCTG TmoC 59.4 59 60.3 59.2 60.9 59.7 57.8 59.1 60.1 60.6 60 60 60 60 58.9 60.5 60.2 60.4 Ensembl location GL841538.1: 159977-159996 GL841538.1: 170123-170142 GL841539.1: 2046503-2046522 GL841539.1: 2056170-2056190 GL842060.1:28389-28408 GL842060.1:37680-37701 GL849899.1: 897357-897382 GL849899.1: 907397-907416 GL864793.1: 314413-314432 GL864793.1: 323764-323784 GL864869.1: 401583-401602 GL864869.1: 409449-409468 GL834491.1:616043-616068 GL834491.1:626099-626120 GL841289.1: 742285 to 742308 GL841289.1: 750622 to 750641 GL834719.1: 21036 to 21055 GL834719.1: 31139 to 31158 * Omitted from further sequencing runs due to either few SNPs amplifying (RAB, KIT) or apparent ascertainment bias (FOX). Table S2 Genomic locations, allele variants, and minor allele frequencies (MAF) for putatively neutral SNPs. Genotype refers to ratio of p2/2pq/q2. Loci showing statistically significant deviation from Hardy-Weinberg equilibrium at α = 0.05 are marked with an *. Marker name SNP contig position and reference allele A1 A2 MAF Genotype O(HET) E(HET) P ERN2.3 Chr2_0397.160216_A T A 0.09 7/18/154 0.101 0.163 0.0001 * Chr2_0397.166864_T C T 0.10 9/19/156 0.103 0.181 0.0000 * Chr2_0397.167259_T T C 0.10 8/20/158 0.108 0.175 0.0000 * Chr2_0397.167436_C C T 0.10 8/20/160 0.106 0.173 0.0000 * Chr2_0397.167456_A G A 0.09 7/21/158 0.113 0.171 0.0002 * Chr2_0397.167603_A G A 0.10 8/20/153 0.111 0.179 0.0000 * Chr2_0397.168015_G A G 0.10 8/19/146 0.110 0.182 0.0000 * Chr2_0397.168022_T C T 0.10 7/20/146 0.116 0.177 0.0002 * Chr2_0397.168607_T T C 0.09 7/20/155 0.110 0.169 0.0002 * Chr2_0397.168661_A A G 0.10 7/21/150 0.118 0.177 0.0003 * Chr2_0397.168755_T T C 0.09 7/20/153 0.111 0.171 0.0002 * Chr2_0397.168785_T T C 0.10 7/21/152 0.117 0.176 0.0003 * Chr2_0397.169005_T C T 0.10 7/20/151 0.112 0.173 0.0002 * Chr2_0397.169068_C C G 0.10 8/20/154 0.110 0.178 0.0000 * Chr2_0397.169525_G A G 0.10 7/20/148 0.114 0.175 0.0002 * Chr2_0397.169609_T C T 0.10 7/20/151 0.112 0.173 0.0002 * Chr2_0397.170050_G G A 0.10 7/20/142 0.118 0.181 0.0003 * UNC13B Chr2_0398.2046719_T T C 0.45 52/133/80 0.502 0.494 0.9011 Chr2_0398.2047424_G G A 0.45 55/130/84 0.483 0.494 0.7125 Chr2_0398.2047432_A A G 0.46 55/138/77 0.511 0.497 0.7133 Chr2_0398.2049841_T T C 0.46 53/140/73 0.526 0.497 0.3885 Chr2_0398.2050495_C C T 0.46 56/135/78 0.502 0.497 0.9028 Chr2_0398.2052291_G G C 0.45 54/134/78 0.504 0.496 0.9016 Chr2_0398.2052296_C C A 0.45 55/132/80 0.494 0.496 1.0000 Chr2_0398.2052757_C T C 0.04 1/15/218 0.064 0.070 0.2601 Chr2_0398.2053020_T T C 0.46 55/137/76 0.511 0.497 0.7125 NF2 Chr2_0398.2053704_G G A 0.46 56/134/79 0.498 0.496 1.0000 Chr2_0398.2054104_C C T 0.46 53/138/77 0.515 0.496 0.6221 Chr2_0398.2055158_C C T 0.45 56/133/81 0.493 0.496 0.9028 Chr2_0398.2055543_G G T 0.47 55/140/72 0.524 0.498 0.4607 Chr2_0398.2055897_C C G 0.45 54/134/78 0.504 0.496 0.9016 Chr2_0919.28530_T C T 0.26 18/91/131 0.379 0.389 0.7398 Chr2_0919.28659_G T G 0.24 14/87/137 0.366 0.367 1.0000 Chr2_0919.28793_T C T 0.24 15/86/141 0.355 0.365 0.7242 Chr2_0919.28859_G C G 0.25 16/92/136 0.377 0.379 1.0000 Chr2_0919.28860_G A G 0.25 16/91/137 0.373 0.377 0.8656 Chr2_0919.29023_A G A 0.26 18/91/135 0.373 0.385 0.6193 Chr2_0919.29195_C T C 0.26 17/92/137 0.374 0.381 0.7400 Chr2_0919.29212_A G A 0.26 19/90/136 0.367 0.386 0.5070 Chr2_0919.29213_C T C 0.26 20/89/136 0.363 0.388 0.3242 Chr2_0919.29327_T C T 0.25 16/91/138 0.371 0.376 0.8652 Chr2_0919.29357_T C T 0.25 16/91/137 0.373 0.377 0.8656 Chr2_0919.29471_C T C 0.25 17/86/137 0.358 0.375 0.4924 Chr2_0919.29576_A G A 0.25 16/88/138 0.364 0.373 0.7302 Chr2_0919.29580_T A T 0.25 16/88/138 0.364 0.373 0.7302 Chr2_0919.29620_T C T 0.25 17/91/139 0.368 0.378 0.7361 Chr2_0919.29725_A C A 0.26 19/90/138 0.364 0.384 0.4102 Chr2_0919.29823_C A C 0.25 15/92/139 0.374 0.373 1.0000 Chr2_0919.30018_G A G 0.26 18/89/134 0.369 0.384 0.6143 Chr2_0919.30338_C T C 0.25 15/90/139 0.369 0.371 1.0000 Chr2_0919.30497_C T C 0.25 15/86/131 0.371 0.375 0.8614 Chr2_0919.30845_T G T 0.26 17/91/134 0.376 0.383 0.7394 Chr2_0919.31193_G A G 0.25 15/76/123 0.355 0.373 0.4673 Chr2_0919.31355_T C T 0.05 3/16/193 0.075 0.098 0.0120 Chr2_0919.34312_G A G 0.26 18/91/133 0.376 0.387 0.6218 Chr2_0919.34895_A G A 0.26 19/91/134 0.373 0.389 0.5123 Chr2_0919.34921_C T C 0.26 18/89/137 0.365 0.381 0.5030 Chr2_0919.34958_T C T 0.26 19/89/135 0.366 0.386 0.4093 * PLEK AGA Chr2_0919.34960_G T G 0.26 17/91/135 0.375 0.382 0.7385 Chr2_0919.35096_C T C 0.25 16/92/140 0.371 0.375 0.8659 Chr2_0919.35132_G A G 0.26 20/90/140 0.360 0.385 0.3241 Chr2_0919.35281_A G A 0.26 18/91/140 0.366 0.380 0.5096 Chr2_0919.35282_C G C 0.26 18/91/140 0.366 0.380 0.5096 Chr2_0919.35287_T C T 0.25 18/91/141 0.364 0.379 0.5079 Chr2_0919.35499_A C A 0.25 18/91/144 0.360 0.376 0.5040 Chr2_0919.36121_G C G 0.25 18/86/137 0.357 0.378 0.3948 Chr2_0919.36169_A G A 0.25 16/89/136 0.369 0.376 0.7348 Chr2_0919.36205_T C T 0.26 17/92/134 0.379 0.384 0.8673 Chr2_0919.36792_C A C 0.26 19/93/144 0.363 0.381 0.5107 Chr2_0919.37297_C T C 0.25 18/96/147 0.368 0.378 0.6268 Chr2_0919.37335_G A G 0.25 18/95/146 0.367 0.378 0.6235 Chr2_0919.37386_G C G 0.25 19/93/145 0.362 0.380 0.5104 Chr3_0377.897441_T C T 0.20 05-11-36 0.212 0.322 0.0206 * Chr3_0377.898554_A G A 0.19 5/15/45 0.231 0.311 0.0454 * Chr3_0377.898628_A G A 0.18 4/15/44 0.238 0.298 0.1067 Chr3_0377.900375_T G T 0.20 4/22/50 0.290 0.317 0.4685 Chr3_0377.900444_C A C 0.20 5/17/45 0.254 0.322 0.1179 Chr3_0377.902176_T C T 0.19 3/16/40 0.271 0.303 0.3969 Chr3_0377.902281_T G T 0.08 01-06-42 0.122 0.150 0.2664 Chr3_0377.902727_C A C 0.22 3/15/30 0.313 0.342 0.6694 Chr3_0377.902993_A G A 0.23 6/27/50 0.325 0.360 0.3683 Chr3_0377.903361_G A G 0.19 4/19/47 0.271 0.311 0.2621 Chr3_0377.903493_C T C 0.16 2/15/43 0.250 0.267 0.6259 Chr3_0377.903494_A G A 0.16 2/15/43 0.250 0.267 0.6259 Chr3_0377.905701_C T C 0.17 06-12-51 0.174 0.287 0.0033 Chr3_0377.905962_T C T 0.20 4/26/53 0.313 0.326 0.7368 Chr3_0377.906104_C T C 0.22 6/25/55 0.291 0.338 0.2034 Chr3_0377.907337_G A G 0.18 03-10-31 0.227 0.298 0.1251 Chr6_0069.314505_A G A 0.46 48/88/63 0.442 0.497 0.1185 Chr6_0069.316170_C C T 0.44 47/102/72 0.462 0.494 0.3415 * Ϯ Chr6_0069.316606_C C T 0.45 49/100/70 0.457 0.495 0.2749 Chr6_0069.317401_C C G 0.44 45/89/69 0.438 0.493 0.1183 Chr6_0069.317456_A A C 0.43 44/90/72 0.437 0.491 0.1192 Chr6_0069.317725_T T G 0.44 46/93/73 0.439 0.492 0.1247 Chr6_0069.317800_T C T 0.47 51/101/66 0.463 0.498 0.3405 Chr6_0069.317863_T T C 0.43 46/99/78 0.444 0.490 0.1720 Chr6_0069.318002_G A G 0.46 53/107/70 0.465 0.497 0.3534 Chr6_0069.318369_T T C 0.45 47/97/66 0.462 0.496 0.3312 Chr6_0069.318467_T C T 0.47 53/98/65 0.454 0.499 0.2186 Chr6_0069.318495_G G A 0.45 49/94/71 0.439 0.495 0.0991 Chr6_0069.318612_C C T 0.45 47/97/69 0.455 0.495 0.2678 Chr6_0069.318730_A G A 0.48 50/94/59 0.463 0.499 0.3252 Chr6_0069.318906_G G A 0.43 42/92/69 0.453 0.491 0.3165 Chr6_0069.319090_T T C 0.44 46/93/72 0.441 0.492 0.1260 Chr6_0069.319144_G A G 0.46 52/92/71 0.428 0.496 0.0537 Chr6_0069.319248_A A C 0.45 49/93/69 0.441 0.496 0.1259 Chr6_0069.319483_G G A 0.44 44/91/69 0.446 0.493 0.2004 Chr6_0069.319502_A A G 0.45 47/97/67 0.460 0.496 0.3304 Chr6_0069.320299_T C T 0.47 52/101/66 0.461 0.498 0.2792 Chr6_0069.320529_C T C 0.48 56/101/67 0.451 0.499 0.1798 Chr6_0069.320698_T G T 0.48 57/97/67 0.439 0.499 0.0797 Chr6_0069.320726_G G A 0.45 47/98/69 0.458 0.495 0.2719 Chr6_0069.321559_G G T 0.44 45/100/72 0.461 0.492 0.3377 Chr6_0069.322081_G G A 0.44 51/101/77 0.441 0.494 0.1092 Chr6_0069.322087_G G A 0.45 50/103/74 0.454 0.494 0.2275 Chr6_0069.322108_C T C 0.49 60/100/65 0.444 0.500 0.1091 Chr6_0069.322208_A A G 0.45 52/102/76 0.444 0.495 0.1418 Chr6_0069.322361_G A G 0.48 57/102/67 0.451 0.499 0.1453 Chr6_0069.322763_T T A 0.45 54/106/76 0.449 0.496 0.1501 Chr6_0069.322830_A A G 0.44 52/105/79 0.445 0.494 0.1464 Chr6_0069.322834_G C G 0.47 58/106/70 0.453 0.499 0.1893 Chr6_0069.323484_G A G 0.46 57/104/75 0.441 0.497 0.0886 DRD5 Chr6_0145.405679_A A G 0.25 18/69/124 0.327 0.374 0.0678 Ϯ SNP is predicted to be within a regulatory region. Table S3 Haplotypes and their frequencies for putatively neutral amplicons used in the final genotyping assay. Amplicon Haplotype ERN2.3 TCTCGGACTATTCCACG 0.10 ATCTAAGTCGCCTGGTA 0.90 CAGCTCACCATTTG 0.55 TGATCGCCTGCCGC 0.42 TGATCGCTTGCCGC 0.03 CTCCAGTGTCCTGACCAATTGATAGTCTTAGGCCCGCATAC 0.24 TGTGGACACTTCATTACGCCTGTGACTGCGACTAGATCCGG 0.71 TGTGGACACTTCATTACGCCTGCGACTGCGACTAGATCCGG 0.05 TAATCTTCAGCACTCG 0.80 TAATCTGCAGCACTCA 0.01 TAATCTGCAGCACTCG 0.05 CGGGACTAGATGTCTA 0.13 CGGGACGAGATGTCTA 0.01 ATTGCGTCGCTATAACGCAGTCTATAACGGAGGG 0.57 GCCCATCTATCGCGGTAAGACTGGGGGTAATACA 0.43 A 0.25 G 0.75 UNC13B NF2 PLEK AGA DRD5.1 Frequency Table S4 Comparison of paternity results for eight offspring genotyped at both microsatellite and SNP markers. Sire predictions which differed between the two genotyping methods are in bold. Microsatelllites No. of Predicted loci/alleles Sire Trio delta No of loci/alleles 1039 Top trio LOD 7.67 SNPs Predicted Sire 7.67* 110/220 1025 15.48 15.48* 12/31 1037 1.06 1.07+ 111/222 1037 43.39 13.78* 980 12/31 1037 1.67 5.61* 109/218 1037 26.96 26.96* 1287 980 12/31 1037 1.49 4.85* 111/222 1037 55.78 55.78* 1295 1033 12/33 799 4.71 0.61+ 55/110 1025 23.00 14.02* 1296 1033 12/33 1025 -5.10 27/54 1025 11.66 11.66* 1297 1033 12/33 1025 -6.75 37/74 1025 7.35 7.35* 1298 1033 12/33 1025 -5.75 42/84 1025 24.60 13.88* Breeding group Offspring Dam (known) 1 1282 1034 12/32 2 1284 980 1285 3 Top trio LOD Trio delta Nb. The number of loci and alleles varied between breeding groups due to differing levels of variation (microsatellites) and missing data (microsatellites and SNPs). The number of SNP loci for offspring 1295, 1296, 1297 and 1298 was sub-optimal although increased confidence in the predicted sire called is indicated by higher trio delta scores relative to microsatellites data. Trio deltas are left blank where these are undefined (all possible trio LODs were negative [Marshall et al. 1998]). * Indicates a 95% confidence level as indicated by Cervus; + Indicates an 80% confidence level. Table S5 Multiplex conditions for the 12 microsatellite loci genotyped herein. Plex ID Plex1 Plex2 Plex3 Locus MHCI01 MHCI02 MHCI07 Sh2p Sh2g Sh2v Sh3o Sh6e MHCI05 MHCI06 MHCI08 Sh2L Fluorophore NED PET NED 6-FAM 6-FAM PET 6-FAM NED 6-FAM NED PET VIC Reference (Cheng and Belov 2012) (Cheng and Belov 2012) (Cheng and Belov 2012) (Jones et al. 2003) (Jones et al. 2003) (Jones et al. 2003) (Jones et al. 2003) (Jones et al. 2003) (Cheng and Belov 2012) (Cheng and Belov 2012) (Cheng and Belov 2012) (Jones et al. 2003)
