AP Biology Lab 10: Energy Dynamics
advertisement
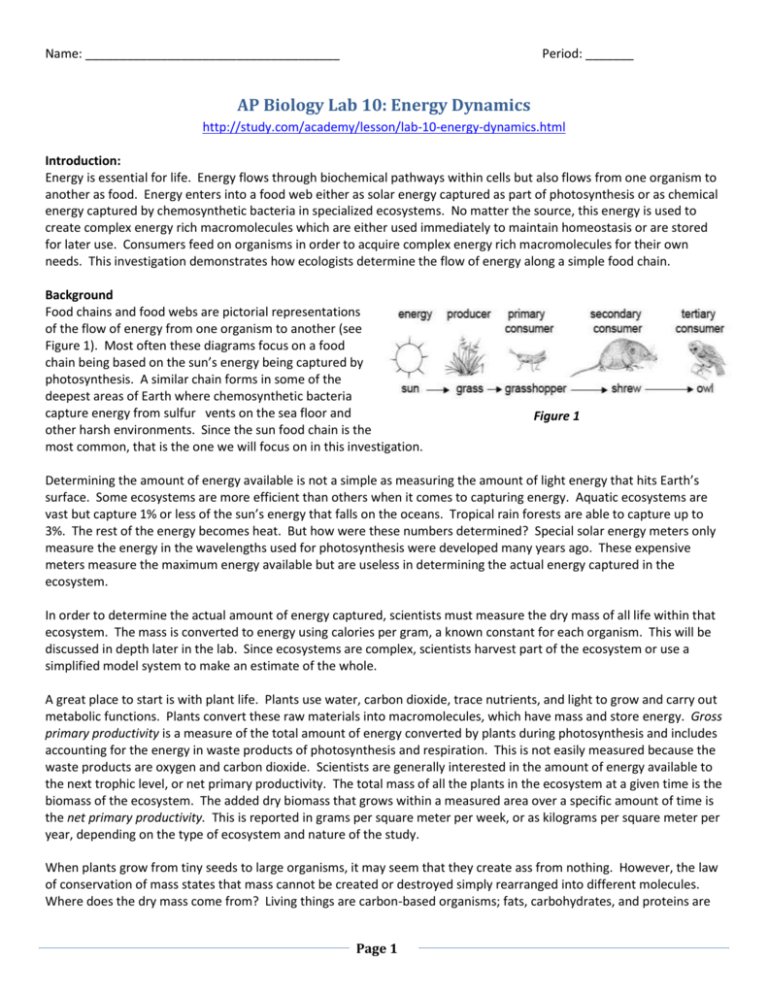
Name: _____________________________________ Period: _______ AP Biology Lab 10: Energy Dynamics http://study.com/academy/lesson/lab-10-energy-dynamics.html Introduction: Energy is essential for life. Energy flows through biochemical pathways within cells but also flows from one organism to another as food. Energy enters into a food web either as solar energy captured as part of photosynthesis or as chemical energy captured by chemosynthetic bacteria in specialized ecosystems. No matter the source, this energy is used to create complex energy rich macromolecules which are either used immediately to maintain homeostasis or are stored for later use. Consumers feed on organisms in order to acquire complex energy rich macromolecules for their own needs. This investigation demonstrates how ecologists determine the flow of energy along a simple food chain. Background Food chains and food webs are pictorial representations of the flow of energy from one organism to another (see Figure 1). Most often these diagrams focus on a food chain being based on the sun’s energy being captured by photosynthesis. A similar chain forms in some of the deepest areas of Earth where chemosynthetic bacteria capture energy from sulfur vents on the sea floor and other harsh environments. Since the sun food chain is the most common, that is the one we will focus on in this investigation. Figure 1 Determining the amount of energy available is not a simple as measuring the amount of light energy that hits Earth’s surface. Some ecosystems are more efficient than others when it comes to capturing energy. Aquatic ecosystems are vast but capture 1% or less of the sun’s energy that falls on the oceans. Tropical rain forests are able to capture up to 3%. The rest of the energy becomes heat. But how were these numbers determined? Special solar energy meters only measure the energy in the wavelengths used for photosynthesis were developed many years ago. These expensive meters measure the maximum energy available but are useless in determining the actual energy captured in the ecosystem. In order to determine the actual amount of energy captured, scientists must measure the dry mass of all life within that ecosystem. The mass is converted to energy using calories per gram, a known constant for each organism. This will be discussed in depth later in the lab. Since ecosystems are complex, scientists harvest part of the ecosystem or use a simplified model system to make an estimate of the whole. A great place to start is with plant life. Plants use water, carbon dioxide, trace nutrients, and light to grow and carry out metabolic functions. Plants convert these raw materials into macromolecules, which have mass and store energy. Gross primary productivity is a measure of the total amount of energy converted by plants during photosynthesis and includes accounting for the energy in waste products of photosynthesis and respiration. This is not easily measured because the waste products are oxygen and carbon dioxide. Scientists are generally interested in the amount of energy available to the next trophic level, or net primary productivity. The total mass of all the plants in the ecosystem at a given time is the biomass of the ecosystem. The added dry biomass that grows within a measured area over a specific amount of time is the net primary productivity. This is reported in grams per square meter per week, or as kilograms per square meter per year, depending on the type of ecosystem and nature of the study. When plants grow from tiny seeds to large organisms, it may seem that they create ass from nothing. However, the law of conservation of mass states that mass cannot be created or destroyed simply rearranged into different molecules. Where does the dry mass come from? Living things are carbon-based organisms; fats, carbohydrates, and proteins are Page 1 primarily carbon, hydrogen, and oxygen. Therefore, the mass of the plant mainly comes from carbon dioxide and, to a lesser extent, water. Primary consumers, those that eat plants, are not able to capture 100% of the plant’s biomass for growth. They use most of the energy they acquire from plants jus to maintain homeostasis. In addition, not all of the plant is digestible and a large fraction is lost as fecal waste, heat, and waste gases. Only a fraction of the energy acquired is used to make more cells (growth). By massing the animal over time, the net secondary productivity can be determined. The productivity loss at each level determines the total number of trophic levels that are able to exist in that ecosystem. This is represented by an ecological pyramid (see Figure 2). A primary consumer assimilates plants and uses most of the plant’s biomass for metabolism. On average 5-20% of the primary consumer’s biomass is converted to growth. A predator (secondary consumer) then eats the primary consumer. Again, much of the herbivore is used to maintain itself and grow. When this predator is consumed by another predator, the amount of biomass available to the next animal on the food chain is once again reduced. A population study would show very few top predators in an ecosystem but thousands of plants. Biomass is typically reported as a dry mass because water content can vary greatly and does not contribute to energy. Consider the differences in the mass of the prairie grass in one square meter area of a prairie in a drought year versus a rainy year. By drying the prairie grass the mass of the macromolecules from one year to the next can be compared. Therefore, calculations must be done on dried plants and animals. The percent dry weight can be calculated by massing the plants when they are harvested then drying them in a controlled environment and reweighing the same plants. Figure 2 The law of conservation of energy also applies to ecosystems. The amount of energy used by the plant for metabolism and growth and lost as waste must equal the amount of energy captured by that plant. Similarly, the amount of energy consumed by the predator must equal that of its metabolism, wastes, and growth. Different biomolecules have different amounts of energy available for use. The amount of energy available in a plant or animal is measured in calories. A calorie is the amount of heat needed to increase the temperature of one gram of water by one degree Celsius. Calories are measured in an instrument called a bomb calorimeter. One gram of dry material is compressed into a disk. When this disk is used as fuel to heat water the change in temperature of the water can be measured to determine the number of calories contained in the original sample. The Calories listed on a food label are actually kilocalories. The food unit is always capitalized while the scientific unit of measure is not. Carbohydrates and proteins have about 4 kcal per gram dry weight. Fats have about 9 kcal per gram dry weight. These numbers are true for plant fats, carbohydrates, and proteins as well as for animal fats, carbohydrates and proteins. The ratio of fats, carbohydrates, and proteins in plants and animals may vary greatly depending on the species and age of the organism. For example, a young shoot may contain mostly carbohydrates and proteins whereas the seeds of a mature plant may contain mostly proteins and fats. In this activity, the plant used is wheat, which is a monocot cereal grain and an important food crop. The type used in this experiment is hard red winter wheat. The grain seeds are harvested for bread and other foodstuffs. Young blades of wheat, called wheatgrass, can also be used as food. Wheatgrass has an overall dry weight energy value of about 4kcal per gram. The wheat seed contains the endosperm, the embryo called the wheat germ, and the hard outer layers called the wheat bran. In this activity, wheat bran will be used as the food source for mealworms. Wheat bran has an overall dry weight energy value of about 4 kcal per gram. Mealworms are the larval form of the Tenebrio molitor beetle. These larvae are used by hobbyists and zoologists as an important food source for many amphibians, birds, fish, reptiles, and small mammals. The mealworm is easily cultivated in wheat bran. One metabolic pathway used by the larvae converts carbohydrates in the wheat bran into the metabolic water larvae needs to survive. In the lab this means that they do not need extra water added to their culture, thereby Page 2 eliminating one experimental variable. Since they are used as a food source, the energy content of the Tenebrio has been determined. Like most living things their caloric value and dry weight varies according to their stage in life. The larvae have an overall energy value of 6.5 kcal/g and are 36% dry weight. The pupae have an overall energy value of 6.4 kcal/g and are 35% dry weight. The adult beetles have an overall energy value of 5.8 kcal/g and are 34% dry weight. Baseline Activity: Estimating Net Productivity of Wheat and Mealworms The Baseline Activity explores the net productivity for wheat and one of its predators, the mealworm. Daily observations allow for the study of the life cycle of a metamorphic animal and the growth of a monocot plant. The results of this baseline activity provide a procedure and model for the inquiry portion of the lab. Procedure: Part A – Wheat 1. Use a dissecting needle or dissection pin to poke at least 30 holes into the bottom of two of the containers. Move the dissection needle or pin around when forming each hole to ensure each hole remains open. 2. Label the container as instructed so it can be identified later. 3. Measure the area of the container in square meters (𝐴 = 𝜋𝑟 2 ). Record here: ____________________________ 4. Fill the two containers about halfway with vermiculite. 5. Thoroughly wet the vermiculite with the dilute fertilizer solution. 6. In each container, distribute 100 wheat seeds even on top of the wet vermiculite. 7. Cover the seeds with a light layer of vermiculite. 8. Place a piece of plastic wrap over the top of the containers while the wheat plants sprout. 9. Place the containers in the planting trays in the grow area. The grow lights should be raised as the plants grow so they are always about 6 inches above the wheat plants. Part B – Mealworms 1. Use a dissecting needle or dissection pin to poke at least 30 holes into the lid of the remaining container. Move the dissection needle or pin around when forming each hole to ensure each hole remains open. 2. Measure the area of the container in square meters (𝐴 = 𝜋𝑟 2 ). Record here: ____________________________ 3. Mass the container with the lid and write this on the side of the container. 4. Mass 10-20g of mealworm diet (wheat bran) in a weighing dish. Record the mass. Transfer to the empty container. Wipe out the weighing dish with a paper towel. 5. In the weighing dish, mass 10-15 mealworms; record the mass. Transfer to the container with the wheat bran. Keep the weighing dish for future measurements. 6. Record the combined mass of the container, wheat bran, and mealworms. 7. Label the container as instructed so it can be identified later. 8. Place the aerated lid onto the container and place the mealworm culture in a designated area. Baseline Activity 1. Make daily observation and maintain the wheat and mealworms for 2-3 weeks. a. Plant maintenance: i. Water the wheat as necessary. ii. Add vermiculite as needed to the wheat containers. The vermiculite holds water but compresses over time. This is especially important over the weekend when plants may dehydrate and die. iii. Remove the plastic wrap once the wheat seeds have grown enough to touch it. b. Animal care: i. Once adults emerge add small pieces of apple to the culture. The adult Tenebrio do not eat wheat bran and will cannibalize the pupa instead. ii. As the culture progresses it may be necessary to add more wheat bran and to collect deceased animals and sheds. Keep track of any mass added and anything removed from the culture. Page 3 2. Once a week: a. Mass the entire mealworm container, wheat bran and Tenebrio. b. Gently collect all of the Tenebrio (mealworms, pupae, and beetles) into a weighing dish and mass them. c. Determine the mass of the solids within the container, including wheat bran, fecal matter, and eggs (if adults are present). 3. Once the wheat reaches a height of 4 inches, harvest the entire crop from one of the two containers: a. Record the number of days since planting. b. Gently remove all of the vermiculite from the roots. Note: this can be a time consuming process. Remove as much vermiculite as possible, and then use a tub of water to rinse off most of the remaining vermiculite. Use gently running water to completely remove the vermiculite. Note: do not rinse large amounts of vermiculite down the drain – it will clog pipes. c. Pat the wheatgrass dry and mass. d. Calculate the average mass per pant. e. Create an aluminum tray using the aluminum foil. f. Mass the aluminum tray. g. Place the wheatgrass onto the tray and place into a 105 degree Celsius laboratory oven. Allow the wheatgrass to dry for 24-48 hours. h. After the wheatgrass has dried, mass again to determine the dry weight. i. Calculate the average dry mass per plant. 4. Allow the remaining container of wheatgrass to grow 1-2 more weeks, and then harvest the remaining wheat crop using the same procedure as in step 3. Data Mealworm Data Mass of the Container (g) Mass of the Entire Culture (g) Mass of Tenebrio (g) Mass of the Wheat Bran (g) Day 1 Day 8 Day 15 Day 22 Wheatgrass Data Mass of Aluminum Tray (g) Mass of All Wheatgrass (g) Average Mass of ONE Wheatgrass (g) Wheatgrass (1st harvest) Wheatgrass (2nd harvest) Page 4 Mass of All Dried Wheatgrass (g) Average Dry Mass per Plant (g) Analysis Questions Answer the following questions while reflecting upon your observations of the wheatgrass, the mealworms, and the data collected. 1. How many kilocalories were transferred from food of the Tenebrio biomass over the course of the experiment? Use 6.5 kcal/g for the dry mass and 36% for the percent dry weight. 2. How many kilocalories of free energy were transformed to chemical energy in wheatgrass from the first harvest to the second harvest? Use 4.0 kcal/g for the dry mass. 3. Was it necessary to add water to the wheatgrass containers? Why? 4. Why was it necessary to mass more than one plant and calculate the average mass? 5. Calculate the net primary productivity in grams per meter per week for the population of wheat plants. 6. Describe the changes in the wheat bran and other solids found in the Tenebrio culture container. Page 5 7. Calculate the net secondary productivity in grams per meter per week for the population of Tenebrio. 8. Did the mealworm container change mass over the weeks of the experiment? What does this indicate about the conservation of mass in a closed system (That is a system in which nothing is added or removed) 9. Did the mealworms grow or progress from larvae to pupae to adults during the experiment? What does this indicate about the conservation of mass in a closed system? 10. Are there ways to increase the net productivity of either the wheat or the Tenebrio? 11. What environmental factors may affect the net productivity? 12. How can the respiration rate be determined for the wheat or the Tenebrio? 13. Is the net primary productivity different for a dicot plant or another small animal? 14. Of the factors identified in the above questions, which can be replicated as an experiment in the laboratory? Page 6 Inquiry Activity Plan, discuss, execute, evaluate, and justify an experiment to test a question regarding the relationship between a plant and its predator, ways to influence the productivity of plants or animals, or determine the productivity of a different species. 1. Decide upon one question that your group would like to explore. 2. Develop a testable hypothesis. 3. Discuss and design a controlled procedure to test the hypothesis. 4. List any safety concerns and the precautions that will be implemented to keep yourself, your classmates, and your instructor safe during the experimental phase of the laboratory. 5. Determine what and how you will collect and record the raw data. 6. How will you analyze the raw data to test your hypothesis? 7. Share your hypothesis, safety precautions, procedure, data tables, and proposed analysis with your instructor prior to beginning the experiment. 8. Once the experiment and analysis are complete, evaluate your hypothesis and justify why or why not the hypothesis was supported by the data. 9. Present and defend your findings to the class. 10. Make suggestions for a new or revised experiment to modify or retest your hypothesis. Page 7

