1) - My FIT
CHE 3265
Quiz 1
Name _______________________________
Section # ____ 04/16/20
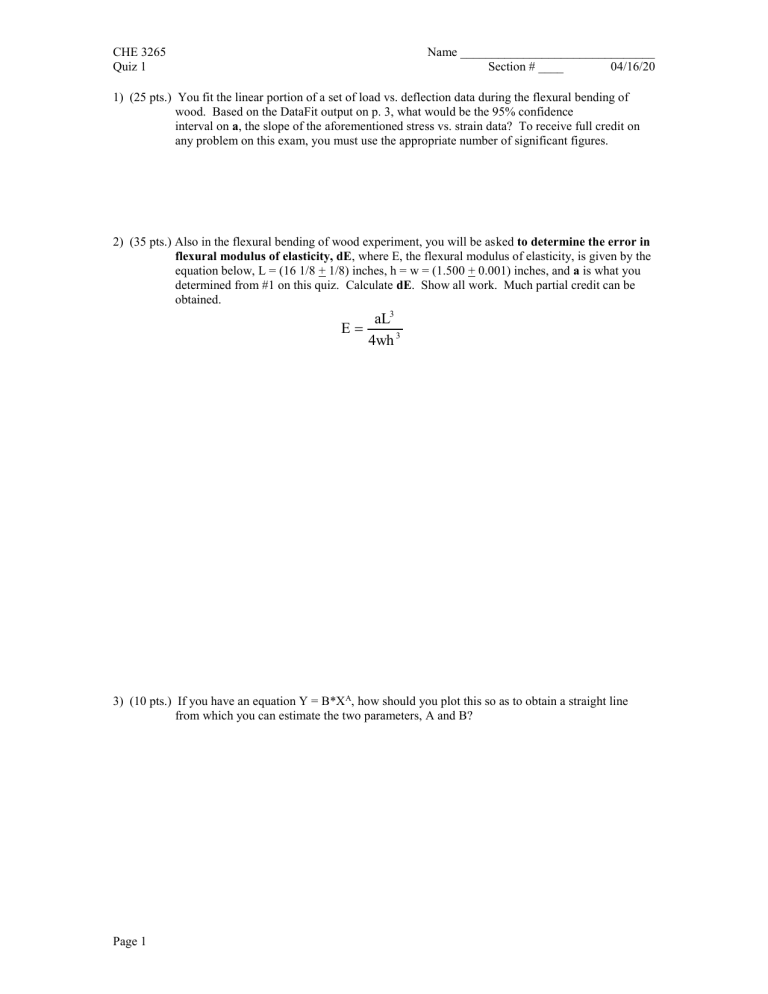
1) (25 pts.) You fit the linear portion of a set of load vs. deflection data during the flexural bending of wood. Based on the DataFit output on p. 3, what would be the 95% confidence interval on a , the slope of the aforementioned stress vs. strain data? To receive full credit on any problem on this exam, you must use the appropriate number of significant figures.
2) (35 pts.) Also in the flexural bending of wood experiment, you will be asked to determine the error in flexural modulus of elasticity, dE , where E, the flexural modulus of elasticity, is given by the equation below, L = (16 1/8 + 1/8) inches, h = w = (1.500 + 0.001) inches, and a is what you determined from #1 on this quiz. Calculate dE . Show all work. Much partial credit can be obtained. aL
3
E
4wh 3
3) (10 pts.) If you have an equation Y = B*X A , how should you plot this so as to obtain a straight line from which you can estimate the two parameters, A and B?
Page 1
CHE 3265
Quiz 1
Name _______________________________
Section # ____ 04/16/20
4) (30 pts. total) Five students measure a set of hardnesses for a brass specimen before annealing and get
80.3, 80.0, 79.2, 80.2, 79.3
A) Calculate the mean hardness before annealing.
B) Calculate the experimental standard deviation in hardness before annealing.
C) Determine the 95% confidence interval for the hardness before annealing.
D) If the 95% confidence interval for the hardness of the same brass sample after annealing was 55 + 3.
Can you say with 95% confidence that the annealing process softened the sample? Your answer must be consistent with part C.
Page 2
CHE 3265
Quiz 1
Name _______________________________
Section # ____ 04/16/20
DataFit version 6.1.10
Results from project "Untitled1"
Equation ID: linear, no intercept
Number of observations = 10
Number of missing observations = 0
Solver type: Nonlinear
Nonlinear iteration limit = 250
Diverging nonlinear iteration limit =10
Number of nonlinear iterations performed = 3
Residual tolerance = 0.0000000001
Sum of Residuals = -8.68171847026153
Average Residual = -0.868171847026153
Residual Sum of Squares (Absolute) = 756.59231040055
Residual Sum of Squares (Relative) = 756.59231040055
Standard Error of the Estimate = 9.16874104044431
Coefficient of Multiple Determination (R^2) = 0.9990829184
Proportion of Variance Explained = 99.90829184%
Adjusted coefficient of multiple determination (Ra^2) = 0.9990829184
Durbin-Watson statistic = 1.64741072469545
Variable Value
Regression Variable Results
Standard Error t-ratio Prob(t) a 5071.632979 27.5481696 184.1005429 0.0
Variable a
68% Confidence Intervals
Value 68% (+/-)
5071.632979 28.9944485
Lower Limit Upper Limit
5042.638531 5100.627428
90% Confidence Intervals
Variable Value a
90% (+/-)
5071.632979 50.49854969
Lower Limit
5021.134429
Upper Limit
5122.131529
95% Confidence Intervals
Variable Value a
95% (+/-)
5071.632979 62.31946926
Lower Limit
5009.31351
Upper Limit
5133.952448
99% Confidence Intervals
Variable Value a
99% (+/-)
5071.632979 89.52604155
Lower Limit
4982.106938
Upper Limit
5161.159021
Source
Variance Analysis
DF Sum of Squares Mean Square F Ratio Prob(F)
Regression 1 824243.4077 824243.4077 9804.739709 0
Error
Total
9 756.5923104 84.06581227
10 825000
Page 3

