FacilitatorNotes - Day 2 AM
advertisement
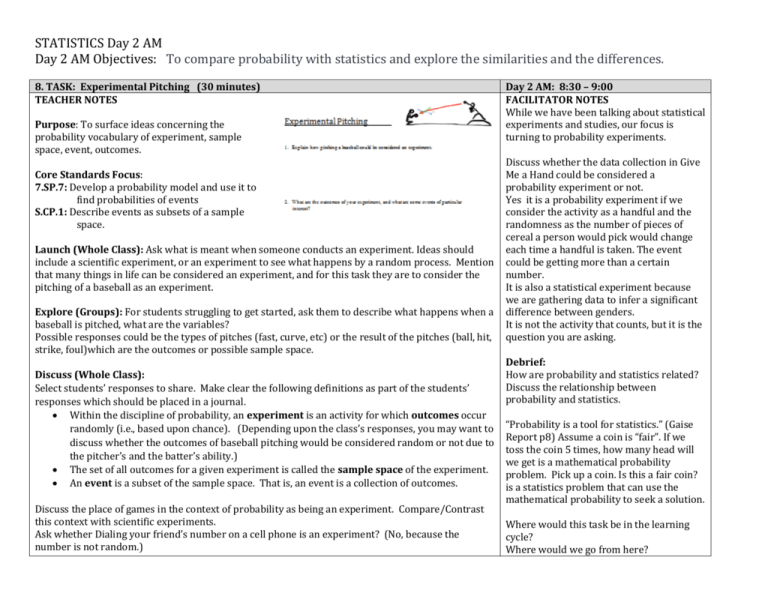
STATISTICS Day 2 AM Day 2 AM Objectives: To compare probability with statistics and explore the similarities and the differences. 8. TASK: Experimental Pitching (30 minutes) TEACHER NOTES Purpose: To surface ideas concerning the probability vocabulary of experiment, sample space, event, outcomes. Core Standards Focus: 7.SP.7: Develop a probability model and use it to find probabilities of events S.CP.1: Describe events as subsets of a sample space. Launch (Whole Class): Ask what is meant when someone conducts an experiment. Ideas should include a scientific experiment, or an experiment to see what happens by a random process. Mention that many things in life can be considered an experiment, and for this task they are to consider the pitching of a baseball as an experiment. Explore (Groups): For students struggling to get started, ask them to describe what happens when a baseball is pitched, what are the variables? Possible responses could be the types of pitches (fast, curve, etc) or the result of the pitches (ball, hit, strike, foul)which are the outcomes or possible sample space. Discuss (Whole Class): Select students’ responses to share. Make clear the following definitions as part of the students’ responses which should be placed in a journal. Within the discipline of probability, an experiment is an activity for which outcomes occur randomly (i.e., based upon chance). (Depending upon the class’s responses, you may want to discuss whether the outcomes of baseball pitching would be considered random or not due to the pitcher’s and the batter’s ability.) The set of all outcomes for a given experiment is called the sample space of the experiment. An event is a subset of the sample space. That is, an event is a collection of outcomes. Discuss the place of games in the context of probability as being an experiment. Compare/Contrast this context with scientific experiments. Ask whether Dialing your friend’s number on a cell phone is an experiment? (No, because the number is not random.) Day 2 AM: 8:30 – 9:00 FACILITATOR NOTES While we have been talking about statistical experiments and studies, our focus is turning to probability experiments. Discuss whether the data collection in Give Me a Hand could be considered a probability experiment or not. Yes it is a probability experiment if we consider the activity as a handful and the randomness as the number of pieces of cereal a person would pick would change each time a handful is taken. The event could be getting more than a certain number. It is also a statistical experiment because we are gathering data to infer a significant difference between genders. It is not the activity that counts, but it is the question you are asking. Debrief: How are probability and statistics related? Discuss the relationship between probability and statistics. “Probability is a tool for statistics.” (Gaise Report p8) Assume a coin is “fair”. If we toss the coin 5 times, how many head will we get is a mathematical probability problem. Pick up a coin. Is this a fair coin? is a statistics problem that can use the mathematical probability to seek a solution. Where would this task be in the learning cycle? Where would we go from here? STATISTICS Day 2 AM Day 2 AM Objectives: To compare probability with statistics and explore the similarities and the differences. Is closing your eyes and haphazardly dialing ten digits on a cell phone an experiment? (Yes, because the number is sort of random.) Discuss the role of random in those events. Additional experiments for students to define the outcomes, sample space, and an event of interest: Taking a swing at a piñata Playing Pin-the-Tail-on-the-Donkey STATISTICS Day 2 AM Day 2 AM Objectives: To compare probability with statistics and explore the similarities and the differences. 9. TASK: Dice Games (60 minutes) TEACHER NOTES Day 2 AM: 9:00 – 10:00 FACILITATOR NOTES Purpose: To use probability to make a decision. Give a pair of dice to each pair of participants Core Standards Focus: 7.SP.5-8: Investigate chance processes and develop, use, and evaluate probability models. S.MD:Using Probability to Make Decisions and Evaluate Outcomes of Decisions S.CP.1: Describe events as subsets of a sample space as unions, intersections, or complements of other events. Related Standards: S.CP.2-5 Materials: A pair of dice for every two students. Launch (Whole Class): Ask students why they play games? Response should be that they play to win. Tell them we are going to play games but that they first get to decide which player they want to be. Read together the rules for the First Game and everyone indicate which player they would want to be (only give 10 seconds at most so they are going with their gut reaction). Repeat for the Second game. Have them play the games with their table partner. Explore Part I (Partners): As the students are playing, watch to see that they are correctly determining the winner in each roll and keeping a tally. Listen for statements of “Not Fair” to be discussed as a whole class. Discuss (Whole Class): Ask the students who protested the “fairness” to explain what they saw happening. Compile the number from all the partners of which player won: Number of Players A Number of Players B who won who won Game One Game Two What do our results tell us about fairness? Ask the class: According to our definition of experiment, is this an experiment? Be sure to define the outcomes and the sample space. When discussing the outcomes, ask the question, how many ways Debrief: Where do the big ideas of probability fit in the core? Discuss the place of probability in the core and in the courses. Concept of probability is in Math 7 and in Secondary II the rules of probability are built. How can we use dice games to build understanding of other probability situations such as intersections or unions? STATISTICS Day 2 AM Day 2 AM Objectives: To compare probability with statistics and explore the similarities and the differences. can we get a particular sum? List all the sums on the board. Discuss whether it is possible to get certain sums more ways than other sums. Explore Part II (Partners): Have the partners create a table to show all the different ways to get the sums. You may need to explain that doubles are only counted once because you cannot tell the difference. For example you can tell the difference with two colored dice between a green 6 and a red 3 with a green 3 and a red 6. But you cannot tell the difference between a green 3 and a red 3 with a red 3 and a green 3. Discuss (Whole Class): Have someone share their results that was very systematic in thinking about the combinations. Lead the discussion to going back to the list of sums, and adding the probability for each sum occurring. Return to the idea of an experiment, the outcomes, and the event. What was the event for First Game? (If you’re player A, getting an odd sum) What was the event for Second Game? (If you’re player A, getting a sum between 5 and 9 inclusively) Direct the partners to consider the two games. What is the probability that each player would win, in other words, would get their event. After a couple of minutes, discuss how the probability for each player on the first game is ½, but that on the second game, Player A has a probability of winning of 2/3 while Player B has a probability of winning of 1/3. Make clear the definition of a game being fair: A game is fair if the each of the players is equally likely to win. How did our theoretical probabilities compare to our experimental probability? Additional problems based on the sum of two dice is Dice Games Part II. STATISTICS Day 2 AM Day 2 AM Objectives: To compare probability with statistics and explore the similarities and the differences. 10. TASK: Mad Probabilist (45 minutes) TEACHER NOTES Purpose: To use combinations in probability and the use of random chance in an event. Core Standards Focus: S.CP.9: Use permutations and combinations to compute probabilities of compound events and solve problems. Related Standards: 7.SP.8 Project a picture of the illustration to aid in discussions. Launch (Whole Class): Read together the situation by which the Mad Probabilist would decide his path. Decide as a group a different path that would get him to the Café. Discuss what the experiment is (activity is moving along the grids and the outcomes are the different paths.) Now point out the question “How many different ways are there?” Ask them to work in their groups to answer that question. Explore I (Groups): As students begin exploring ways to get to the café, they might realize there are a lot of different ways. Allow them about 5 minutes to begin making a table, creating a list, a tree diagram, or other method to determine all the ways. Discuss I (Whole Class): Bring them together to discuss the different methods they used and to wonder if there’s an easier way. Have them return to the paper (2nd side) and discuss the answer to the next question “How many moves does it take to get to (5, 3). Then ask where else he might be after 8 moves to make sure students are getting the idea of the different ending locations for a set number of moves. Encourage them to use grid or dot paper to answer the rest of the questions and that we will come back to the question of how many different paths he could take to get to (5, 3) Explore II (Groups): Watch to make sure students are aware that for a set number of points, there is a diagonal line of possible locations. As the students get to the second side, watch to see that they are counting the ways to each set of locations requiring the same number of moves. Watch and listen for anyone who can see a pattern in the number of paths as the number of moves increase. Day 2 AM: 10:00 – 10:45 FACILITATOR NOTES Keep the first Explore to under 10 minutes so they will have time to work through the diagram. Debrief: How is this task a probability experiment? Define the sample space, the outcomes, and the event. Sample space is all possible routes. Outcome is a specific route. The Event is a subset of the sample space defining a particular point as the target. Discuss the standards and content topic for this task. (This task is an introduction into combinatorics which is an honor topic in Sec II. However, this point does not need to be expressed to participants unless needed.) Where in the learning cycle is this task? STATISTICS Day 2 AM Day 2 AM Objectives: To compare probability with statistics and explore the similarities and the differences. Discuss II (Whole Class): Class discussion should center around anyone who has seen the pattern of adding the previous number of paths coming into a new location. For example the location (2, 2) would have 3 ways since there were 2 ways to get to (1, 2) and 1 way to get to (2,0). Let students know this is Pascal’s Triangle and has become a very useful tool in counting problems. By building the number of paths, we can determine that there are 56 ways to get to the Slow Food Café. Ask the question, what is the probability that the Mad Probabilist’s random walk will end up at the Slow Food Café? Review that the event is to end up at (5,3) so the number of paths to (5, 3) is 56 and the number of paths for 8 moves would be the sum of all the number of ways to get to the locations after 8 moves (256) the probability is 56/256 or about 22%. Ask what is the probability he will end up at (7, 1) where the barbershop is. (8/256=3%) Why is this location a much lower probability? Additional questions using the table created could also be asked to bring the idea of combinations into probability. STATISTICS Day 2 AM Day 2 AM Objectives: To compare probability with statistics and explore the similarities and the differences. 11. TASK: Is the Teacher Really Psychic? (45 minutes) TEACHER NOTES Purpose: To use probability to determine the likelihood of a claim. Core Standards Focus: 7.SP.7: Compare probabilities from a model to observed frequencies. S.MD.7: Analyze decisions using probability concepts S.IC.2: Decide if a specified model is consistent with results from a given data-generating process. Related Standards: 7.SP.5, 7.SP.6, S.IC.1, S.IC.3 EU6-8: 4. Inferential statistics uses data in a sample selected from a population to describe features of the population EU9-12: 3. Hypothesis tests answer the question Do I think this could have happened by random chance? Materials needed: Deck of cards for each group. Ahead of time, seed a display calculator: type 929 (whatever number you choose) press the store key STO> next to the number 1, then press the Math key arrow over to the PRB menu and select rand press enter, and enter again. You should see the number 929 on the screen. Select randint(1,4) in the calculator and when you hit enter 8 times you will get the sequence 3, 1, 2, 4, 4, 4,2,4,1 Memorize the suits that correspond to these numbers according to the launch: club, heart, diamond, spade, spade, spade, diamond, spade, heart. You are psychic! Be sure to seed that number right before the activity without any of the students knowing. Launch (Whole Class): Tell your students that you are psychic and that you are able to determine the suit of a card that can be randomly generated from a calculator. Put the following key on the board: 1 is a heart, a 2 is a diamond, a 3 is a club, and a 4 is spade. Have someone enter the command randint(1,4) which will generate a number randomly from 1 to 4, but before hitting enter, you will tell them what the suit will be. Someone will probably suggest that the calculator was rigged. Ask the students to talk with a table partner about how we could decide whether the teacher is psychic using cards rather than a calculator. (question #1) Discuss together the idea of this being an experiment. What is the activity? (Drawing 3 cards with replacement.) What are the outcomes or sample space? (The four suits three at a time in different combinations, 64 ways.) What is the event (also known as random variable) we are interested in? (Getting all 3 correct.) How could this help us decide? Day 2 AM: 10:45 – 11:30 FACILITATOR NOTES You will need to seed a display calculator without anyone seeing. This task will introduce the use of simulation. Rather than cards, generate 3 random integers from 1-4 where 1 indicates you guessed correctly, and 2-4 you guessed incorrectly. Have each person run 5 trials keeping track of how many times he got 0, 1, 2, or 3 correct. Compile all the results into one table to determine class experimental probabilities. Debrief: How does a probability simulation allow us to evaluate a statistical claim? There is evidence that the performance of the teacher is successfully identifying 8 cards correct is not random. There is no evidence that being psychic is the reason for the non-randomness. Where would this task be in learning cycle? Discuss the binomial expansion of determining probabilities. STATISTICS Day 2 AM Day 2 AM Objectives: To compare probability with statistics and explore the similarities and the differences. Explore (Group): Have students conduct the experiment 10 times using a deck of cards and determine the experimental probability of being psychic. Have them continue the questions to consider the theoretical probability. Discuss (Whole Class): Have a student explain how to determine theoretical probability. Compare it to a combined experimental probability from the class. Have different students with opposing beliefs about the psychic ability of the teacher explain their case. They should use either the experimental or theoretical probabilities as evidence of their decision. Discuss what a good chance is as opposed to a bad chance. Make clear that we are asking the question of whether getting three cards correct in a row could happen by random chance or if there is some other ability at work to make it happen. Answers: 4 a) ¼ b) 27/64, 27/64, 9/64, 1/64 c) 15.6%
