FeSCN2+ Equilibrium Lab Report: Keq Determination
advertisement
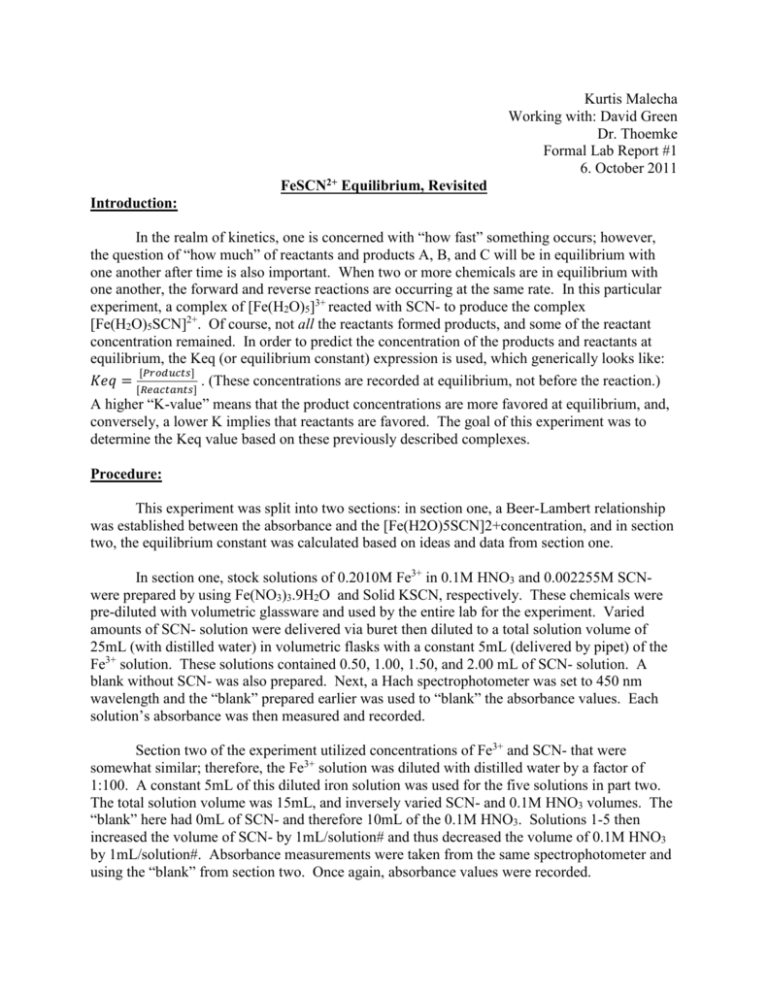
Kurtis Malecha Working with: David Green Dr. Thoemke Formal Lab Report #1 6. October 2011 FeSCN2+ Equilibrium, Revisited Introduction: In the realm of kinetics, one is concerned with “how fast” something occurs; however, the question of “how much” of reactants and products A, B, and C will be in equilibrium with one another after time is also important. When two or more chemicals are in equilibrium with one another, the forward and reverse reactions are occurring at the same rate. In this particular experiment, a complex of [Fe(H2O)5]3+ reacted with SCN- to produce the complex [Fe(H2O)5SCN]2+. Of course, not all the reactants formed products, and some of the reactant concentration remained. In order to predict the concentration of the products and reactants at equilibrium, the Keq (or equilibrium constant) expression is used, which generically looks like: [𝑃𝑟𝑜𝑑𝑢𝑐𝑡𝑠] 𝐾𝑒𝑞 = [𝑅𝑒𝑎𝑐𝑡𝑎𝑛𝑡𝑠] . (These concentrations are recorded at equilibrium, not before the reaction.) A higher “K-value” means that the product concentrations are more favored at equilibrium, and, conversely, a lower K implies that reactants are favored. The goal of this experiment was to determine the Keq value based on these previously described complexes. Procedure: This experiment was split into two sections: in section one, a Beer-Lambert relationship was established between the absorbance and the [Fe(H2O)5SCN]2+concentration, and in section two, the equilibrium constant was calculated based on ideas and data from section one. In section one, stock solutions of 0.2010M Fe3+ in 0.1M HNO3 and 0.002255M SCNwere prepared by using Fe(NO3)3.9H2O and Solid KSCN, respectively. These chemicals were pre-diluted with volumetric glassware and used by the entire lab for the experiment. Varied amounts of SCN- solution were delivered via buret then diluted to a total solution volume of 25mL (with distilled water) in volumetric flasks with a constant 5mL (delivered by pipet) of the Fe3+ solution. These solutions contained 0.50, 1.00, 1.50, and 2.00 mL of SCN- solution. A blank without SCN- was also prepared. Next, a Hach spectrophotometer was set to 450 nm wavelength and the “blank” prepared earlier was used to “blank” the absorbance values. Each solution’s absorbance was then measured and recorded. Section two of the experiment utilized concentrations of Fe3+ and SCN- that were somewhat similar; therefore, the Fe3+ solution was diluted with distilled water by a factor of 1:100. A constant 5mL of this diluted iron solution was used for the five solutions in part two. The total solution volume was 15mL, and inversely varied SCN- and 0.1M HNO3 volumes. The “blank” here had 0mL of SCN- and therefore 10mL of the 0.1M HNO3. Solutions 1-5 then increased the volume of SCN- by 1mL/solution# and thus decreased the volume of 0.1M HNO3 by 1mL/solution#. Absorbance measurements were taken from the same spectrophotometer and using the “blank” from section two. Once again, absorbance values were recorded. Results: The data were then obtained through these absorbance measurements. The following are the results from part 1 of the experiment: Table 1 Solution mL of SCN- (+/0.020) 0 0.52 1.01 1.51 2.06 B1 C D E F [Fe(H2O)5SCN]+2 0 4.69E-05 9.11E-05 1.36E-04 1.86E-04 Absorbance (+/0.003) 0 0.190 0.368 0.530 0.701 The [Fe(H2O)5SCN]+2 concentration was determined by the given molarities and the assumptions that the SCN- all complexed to form [Fe(H2O)5SCN]+2 and the SCN- initial concentration was equal to the [Fe(H2O)5SCN]+2 complex. Here, this assumption is not valid (for the second section) because of not only calculations but also the fact that for the second section, the SCN- and [Fe(H20)5]3+ have similar concentrations. For these1,6, and all proceeding calculations, see the appendix. (A superscripted number corresponds to the calculation “number.”) A graph of the absorbance versus the [Fe(H2O)5SCN]+2 complex was then made with the associated LINEST calculations. See below for this graph and LINEST output. Absorbance vs. [Fe(H2O)5SCN]+2 0.800 0.700 y = 3777.5x + 0.0103 R² = 0.9985 0.600 Abs 0.500 0.400 0.300 0.200 0.100 0.000 0 0.00002 0.00004 0.00006 0.00008 0.0001 0.00012 0.00014 0.00016 0.00018 0.0002 [Fe(H2O)5SCN]+2 Slope Value of Intercept Standard Deviation of Slope Standard Deviation of Intercept R2 Standard Error of Y 3777.516076 0.010253411 83.91012094 0.009461895 0.99852193 0.01223275 For part 2, the absorbance values were used to calculate the [Fe(H2O)5SCN]+2 equilibrium concentration based on the linear regression line provided by Excel. A summary of these data are below: Table 2 Solution Absorbance (+/- 0.003) B2 1 0 0.105 [Fe(H2O)5SCN]+2 [Fe(H2O)5]+3 [SCN-] (+/(+/- 0.009743) (+/- 7.137E3.049E-06) 11) 0 6.7E-04 0 2.507E-05 6.7E-04 1.518E-04 2 0.201 5.048E-05 6.7E-04 3.007E-04 3 0.302 7.722E-05 6.7E-04 4.570E-04 4 0.406 1.047E-04 6.7E-04 5.983E-04 5 0.505 1.309E-04 6.7E-04 7.487E-04 Keq 0 246+/95779 250+/48359 252+/31820 261+/24305 261+/19422 The [SCN-] and [Fe(H2O)5]+3 concentrations were calculated using the dilution 𝐶1∗𝑉1 equation2,3, 𝐶2 = 𝑉2 and the [Fe(H2O)5SCN]+2 concentration equation used was a modified 𝑦−𝑏 version of the linear regression function4: 𝑎 = 𝑥 where “y” is the absorbance from part 1, “b” is the intercept, “a” is the slope coefficient, and “x” is the concentration of the [Fe(H2O)5SCN]+2 from the LINEST output above. [𝐅𝐞(𝐇𝟐𝐎)𝟓𝐒𝐂𝐍]+𝟐 K was then calculated5 using the following formula:𝐾 = [𝐅𝐞(𝐇𝟐𝐎)𝟓]+𝟑∗[𝐒𝐂𝐍−] . For the uncertainty analysis, see the appendix. Discussion/Conclusion: The results of this experiment are not valid/precise. As can be seen by the error of the Keq value, this error is much, much larger than that of any of the Keq values themselves. Ultimately, this gross error results from the intercept error in calculation 4. It was attempted to not use 0,0 as a data point for the experiment, but that made the error worse than what was already observed. In order to make this error not be so atrocious, more samples of part one to make the Beer-Lambert plot should be taken and thus the intercept would be more likely to go through zero with more data points. Also, the data do appear to “curve” in a logarithmic fashion by visual inspection of the graph from part one. While the precision of the data is not “good,” the accuracy is a bit better. In comparison with literature, much has been learned. In the Ramette (1) article, he sets up a rather interesting way of utilizing Cf and Cs to calculate the K (or Q in this case) and thus not needing the “absorptivity of the complex ion.” It was also interesting about his discussion of the acids and the prevention of “higher complexes” by keeping the hydronium ion concentration high. The article by Henry Frank, et al. (2) was also interesting to see the discussion of neglecting the “higher terms.” They set up a similar way to calculate K, but the Ramette article seems to be much more straightforward. Additionally an article from Augusta State University (3) was used stating that ionic strength effects had to be taken into account when calculating the equilibrium value. To correct for the effects of ionic strength, the activity coefficient had to be found for each species. As the ionic strength decreases, the equilibrium constant increases. However, if the experiment was run at a high acid concentration, the ionic strength can be assumed to be constant. This assumption is similar to the Ramette article. In the article by Lister (4) it was also shown that temperature also affects the outcome for the equilibrium constant and should be taken into account. As temperature increases, the equilibrium value decreases. The equilibrium constant values for this experiment were found to be between 246 and 261. When the papers calculated their equilibrium values taking ionic strength into account they found their values to be between 133 and 193. When the papers calculated their equilibrium values taking temperature into account they found their values to be between 118 and 155. A possible reason for the higher K values observed in this experiment would be a relatively low ionic strength, but the ionic strength was considered to be constant because of a high acid concentration, so the K value is somewhat accurate, but not precise. By doing this experiment again, one could take more measurements for the measurements. References: 1. 2. 3. 4. Ramette, R.W. J. Chem. Educ., 1963, 40, 71. Frank, H.S., Oswalt, R.L., J. Am. Chem. Soc. 1947, 69, 1321. Cobb, C.L. Love, G.A., Journal of Chemical Education.1998, 75, 90-92. Lister, M.W., Rivington, D.E., Can. J. Chem. 1955, 33, 1572. Appendix: See attached sheets.

![Equilibrium Constant Determination: [Fe(H2O)5(SCN)]2+](http://s3.studylib.net/store/data/007820256_2-98c468f6aff24a71374580ff7950397c-300x300.png)


