vegetation fragments
advertisement

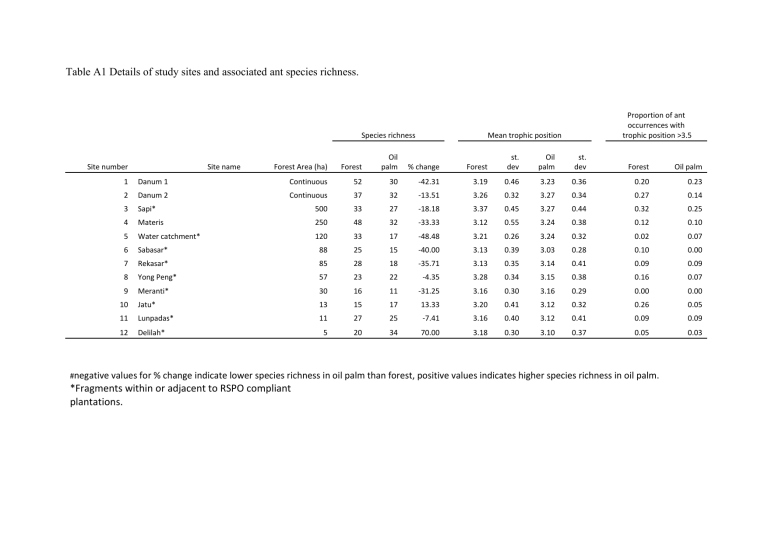
Table A1 Details of study sites and associated ant species richness. Species richness Site number Site name Proportion of ant occurrences with trophic position >3.5 Mean trophic position Forest Area (ha) Forest Oil palm % change Forest st. dev Oil palm st. dev Forest Oil palm 1 Danum 1 Continuous 52 30 -42.31 3.19 0.46 3.23 0.36 0.20 0.23 2 Danum 2 Continuous 37 32 -13.51 3.26 0.32 3.27 0.34 0.27 0.14 3 Sapi* 500 33 27 -18.18 3.37 0.45 3.27 0.44 0.32 0.25 4 Materis 250 48 32 -33.33 3.12 0.55 3.24 0.38 0.12 0.10 5 Water catchment* 120 33 17 -48.48 3.21 0.26 3.24 0.32 0.02 0.07 6 Sabasar* 88 25 15 -40.00 3.13 0.39 3.03 0.28 0.10 0.00 7 Rekasar* 85 28 18 -35.71 3.13 0.35 3.14 0.41 0.09 0.09 8 Yong Peng* 57 23 22 -4.35 3.28 0.34 3.15 0.38 0.16 0.07 9 Meranti* 30 16 11 -31.25 3.16 0.30 3.16 0.29 0.00 0.00 10 Jatu* 13 15 17 13.33 3.20 0.41 3.12 0.32 0.26 0.05 11 Lunpadas* 11 27 25 -7.41 3.16 0.40 3.12 0.41 0.09 0.09 12 Delilah* 5 20 34 70.00 3.18 0.30 3.10 0.37 0.05 0.03 #negative values for % change indicate lower species richness in oil palm than forest, positive values indicates higher species richness in oil palm. *Fragments within or adjacent to RSPO compliant plantations. Table A2 Results of analyses of seven ant species richness estimators examining relationships between species richness within forest fragment sites and adjacent oil palm plantations, and relationships between species richness in forest fragments with ln(fragment area). Forest vegetation quality (PC1 factor score), distance from coast and forest fragment isolation were not important predictors of forest ant species richness, and did not improve model fits. Thus only results for models including ln(fragment area) are presented. Analyses comparing forest and oil palm richness were run excluding a 5 ha site which was an outlier (Fig. 2). relationship between richness in forest and adjacent oil palm (excluding 5ha site: n=11) Smax MMmean Margalef's index Jackknife1 Bootstrap ACE Chao1 relationship between forest species richness and ln(fragment area) (n=10 sites) adj. R2 F1,9 p adj. R2 F1,8 p 0.39 7.48 0.02 0.61 14.93 0.005 0.74 28.78 0.0004 0.55 12.13 0.008 0.49 10.78 0.009 0.58 13.41 0.006 0.73 27.59 0.0005 0.57 13.02 0.007 0.68 21.96 0.001 0.52 10.76 0.01 0.33 5.95 0.04 0.47 8.93 0.02 0.35 6.40 0.03 0.49 9.52 0.01 Table A3- Results of the Principal Components Analysis of seven forest vegetation variables. Details for measuring variables are in the main text. Component % variance accounted for Cumulative % Eigen value Variables: ground cover (%) tree density (trees/ ha) sapling density (saplings/ ha) sapling GBH (mm) tree GBH (mm) canopy cover (%) shade cover (%) 1 37.90 2 16.71 3 14.87 37.90 54.61 69.48 2.65 1.17 1.04 -.349 .579 .547 .796 -.018 .388 .642 -.110 -.182 .369 .687 -.481 .644 -.499 .008 .727 -.149 .498 .638 -.282 -.282 Supplementary information A4- Proportion of groundcover in plantations. Graph A- mean and standard deviation of ground cover (arcsine square root transformed) within sites (N= 5 stations, hollow data points), and across sites (N= 12 sites, filled data point). Graph B- Percentage groundcover at stations with distance from forest (m), and spearman rank order correlation. Graph C- ln(Species richness) at stations with Percentage groundcover at stations, and Spearman rank order correlation. A 120 3,5 B 3 ln (Species Richness) %Groundcover 100 C 80 60 40 20 2,5 2 1,5 1 0,5 0 0 0 100 200 300 400 Distance from forest (m) Spearman rank order correlation: rs=-0.10, P=0.4 500 600 0 20 40 60 80 %Groundcover Spearman rank order correlation: rs=-0.02, P=0.9 100 120


