fishy-frequencies
advertisement
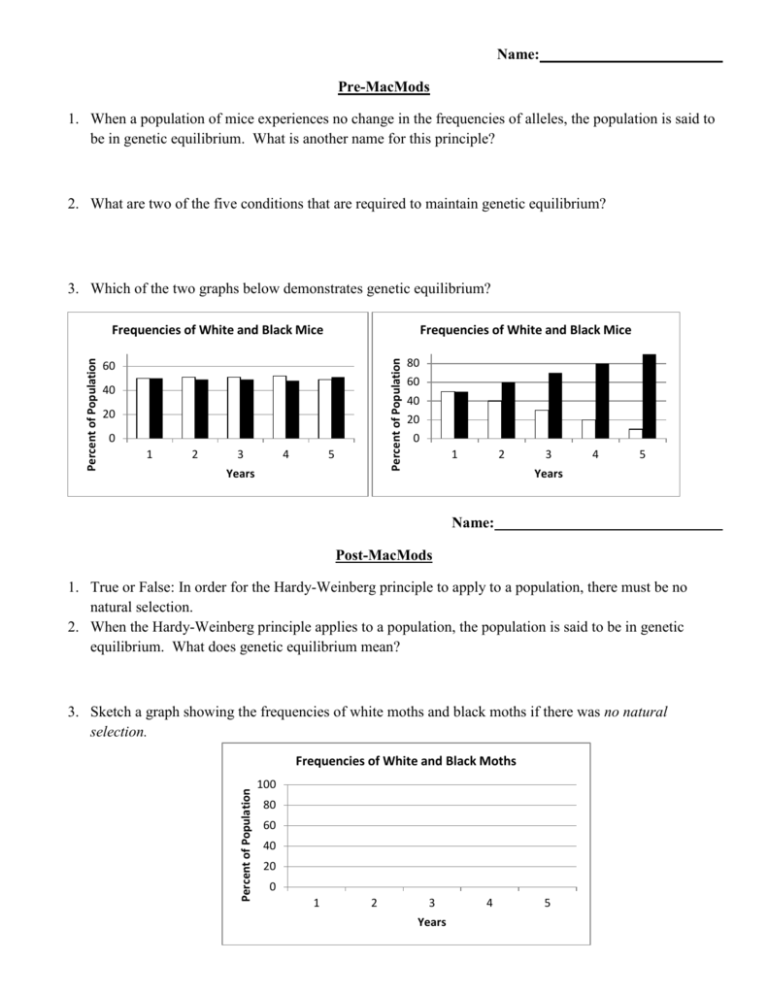
Name: Pre-MacMods 1. When a population of mice experiences no change in the frequencies of alleles, the population is said to be in genetic equilibrium. What is another name for this principle? 2. What are two of the five conditions that are required to maintain genetic equilibrium? 3. Which of the two graphs below demonstrates genetic equilibrium? Frequencies of White and Black Mice Percent of Population Percent of Population Frequencies of White and Black Mice 60 40 20 0 1 2 3 4 5 Years 80 60 40 20 0 1 2 3 4 5 Years Name: Post-MacMods 1. True or False: In order for the Hardy-Weinberg principle to apply to a population, there must be no natural selection. 2. When the Hardy-Weinberg principle applies to a population, the population is said to be in genetic equilibrium. What does genetic equilibrium mean? 3. Sketch a graph showing the frequencies of white moths and black moths if there was no natural selection. Percent of Population Frequencies of White and Black Moths 100 80 60 40 20 0 1 2 3 Years 4 5 Name: Fishy Frequencies Introduction: Understanding how natural selection affects the phenotypes of a population can be difficult and confusing. People often think that animals consciously adapt to their environments- that the peppered moth changed its color, the giraffe can permanently stretch its neck, the polar bear can turn itself white- all so that they can better survive in their environments. In this lab, we will use fish crackers to investigate how natural selection influences phenotypic frequencies in a population of lionfish. Background: Facts about the “fish” 1. Invasive lionfish are thought to have no natural predators in their new environment so the only source of death is natural. 2. However, some people have observed grouper eating lionfish. 3. Lionfish come with two phenotypes for color- bright red and dark brown a. Bright red: this is recessive (rr)- represented by gold fish crackers b. Dark brown: this is dominant (RR or Rr)- represented by brown fish crackers 4. New fish are born every year and the birth rate equals the death rate. We will simulate births by reaching into the pool of “spare fish” and selecting randomly. 5. We will be completing two simulations to investigate how natural selection affects the frequency of phenotypes over time. Simulation 1: No grouper predation. 1. 2. 3. 4. 5. 6. 7. Get a random population of 10 fish from the “ocean”. This will represent the population at Year 1. Count the number of red and brown fish and record in the data table. Close your eyes and randomly choose three fish that die. Close your eyes and randomly choose three fish from the “ocean” to be born into the population. Record the number of red and brown fish for Year 2. Repeat steps 3-5 until you have completed 5 years. Provide your results to the class and fill in the class results table. Table 1: Partner data Year 1 2 3 4 5 # of Red Lionfish # of Brown Lionfish % Red Lionfish % Brown Lionfish Simulation 2: With grouper predation. For this simulation, grouper will be providing the source of mortality for the lionfish. Grouper are able to see the bright red lionfish better than the brown ones, so the red ones are eaten first. 1. Get a random population of 10 fish from the “ocean”. This will represent the population at Year 1. 2. Count the number of red and brown fish and record in the data table. 3. Remove three red lionfish from the population to represent grouper predation (if there are no red lionfish, then remove brown lionfish). 4. Close your eyes and randomly choose three fish from the “ocean” to be born into the population. 5. Record the number of red and brown fish for Year 2. 6. Repeat steps 3-5 until you have completed 5 years. 7. Provide your results to the class and fill in the class results table. Table 2: Partner Data Year # of Red Lionfish # of Brown Lionfish % Red Lionfish % Brown Lionfish 1 2 3 4 5 Table 3: Class Data Year 1 2 3 4 5 # of Red Lionfish Simulation 1 # of Brown Lionfish % Red Lionfish % Brown Lionfish # of Red Lionfish Simulation 2 # of Brown Lionfish % Red Lionfish % Brown Lionfish Analysis 1. Create one bar graph of both sets of class data (Table 3) for both the red and brown lionfish. 2. In either situation, did the frequencies stay approximately the same over time? If yes, which situation? 3. Which situation demonstrated natural selection? What happened to the frequencies of lionfish over time? 4. Did the red lionfish ever completely disappear from the population? Why or why not? When there is no change in phenotypic frequencies within a species, the population is said to be in genetic equilibrium. This concept is known as the Hardy-Weinberg principle. Five conditions are required to maintain genetic equilibrium: The population must be very large There must be no movement into or out of the population (other than births or deaths) There must be random mating There must be no mutations within the gene pool There must be no natural selection 5. Which simulation demonstrated the Hardy-Weinberg principle? How did you know? 6. Which simulation did NOT demonstrate the Hardy-Weinberg principle? Which of the five requirements was violated in the simulation?
