Hackelton.ppt
advertisement
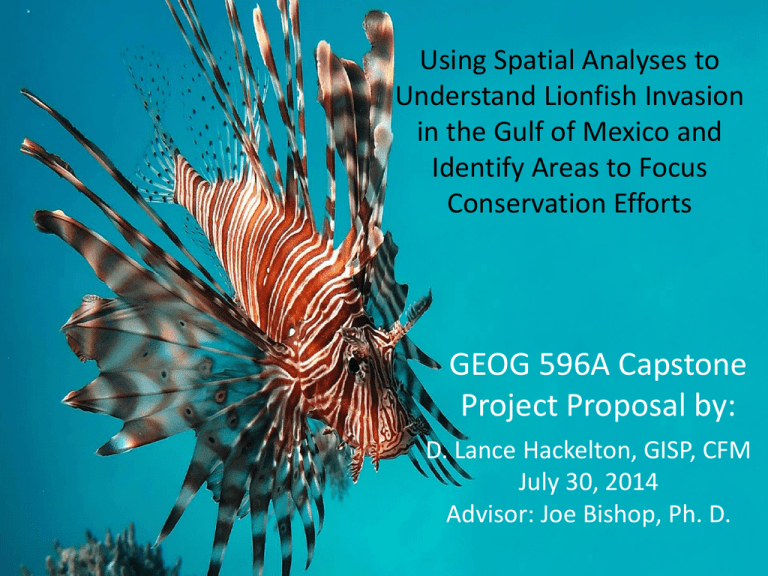
Using Spatial Analyses to Understand Lionfish Invasion in the Gulf of Mexico and Identify Areas to Focus Conservation Efforts GEOG 596A Capstone Project Proposal by: D. Lance Hackelton, GISP, CFM July 30, 2014 Advisor: Joe Bishop, Ph. D. Personal Info • • • • • • Bachelor’s in Health Science – University of North Florida, 2004 GIS Certificate – Pennsylvania State University, 2009 GIS Professional Certificate 63320 – GIS Certification Institute, 2013 Taylor Engineering, Inc. – 2005 – present – Geospatial Scientist Creekside High School – 2009 – present – Academy of Environmental and Urban Planning Advisory Board Member Employed in the field of GIS for almost 12 years Outline • • • • • • • • • • Invasive Species Lionfish Intro The Problem Goals & Objectives Data Methods Implications Timeline Acknowledgements Q&A What are Invasive Species? Defined by the National Invasive Species Council as: “an alien species whose introduction does or is likely to cause economic or environmental harm or harm to human health” Where do lionfish come from? Map Credit: NOAA How did they get here? Why is this a problem? Why is it important? • • • • Reef ecosystems are in jeopardy Adverse impacts to stakeholders Snowballing Understanding the invasion on a regional scale is an important first step Why use spatial analysis? • Geographic component • Power of GIS • A tool, not a solution Goals and Objectives • Goal: Develop an understanding of the lionfish invasion of the Gulf of Mexico and to predict where it is likely to spread The Invasion Data Sources • Reported lionfish sightings Data Sources • Reef locations Data Sources • Bathymetry – NOAA • Wish list – Salinity – Currents – Reef fish distribution • Objective: Build geodatabase using Arc Marine Data Model schema Methods • Location series points of lionfish sightings • Feature points of reef locations (coral, hard substrate, artificial) • Bathymetric raster data • Objective: Use Inverse Distance Weighted (IDW) analysis combined with cellular automata to perform temporal analysis Time + number of occurrences per cell Methods • Apply values to cells based on cumulative number of occurrences • Inverse Distance Weighted Analysis • Objective: Use cellular automata to model habitat vulnerability Reef location + bathymetry Methods • Apply weighted values to cells based on sum of qualifying criteria Implications • Regional fisheries management plans – Reef fish – Corals • Areas to focus conservation efforts Timeline • July 2014: Complete proposal • August thru October 2014: Conduct further research and perform analysis • October thru December 2014: Compile results in full report, present findings at conference Where to present? • • • • • • • ESRI Ocean GIS Forum, November 2014 NSGIC Midyear Meeting, February 2015 ESRI Southeast User Conference, May 2015 UCGIS Symposium, May 2015 ESRI International User Conference, July 2015 Society For Conservation GIS, July 2015 Suggestions? Special Thanks to: • • • • • • Joe Bishop, Ph.D., PSU Jorge Brenner, Ph.D., The Nature Conservancy Michael Thompson, M.Sc., The Nature Conservancy Alexandra Carvalho, Ph.D. GISP, CMAR Consulting, LLC Ken Craig, P.E., Taylor Engineering, Inc. Matthew Johnston, Nova Southeastern University Questions?
