Physics Lab: Measurement & Data Analysis - High School
advertisement
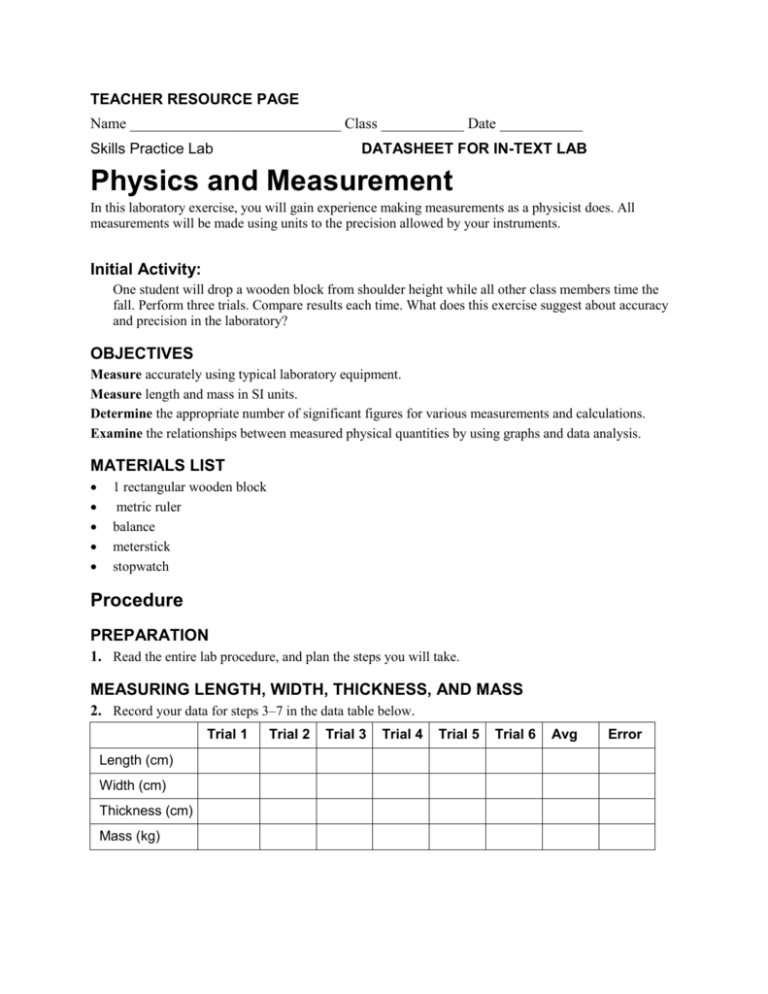
TEACHER RESOURCE PAGE Name ____________________________ Class ___________ Date ___________ Skills Practice Lab DATASHEET FOR IN-TEXT LAB Physics and Measurement In this laboratory exercise, you will gain experience making measurements as a physicist does. All measurements will be made using units to the precision allowed by your instruments. Initial Activity: One student will drop a wooden block from shoulder height while all other class members time the fall. Perform three trials. Compare results each time. What does this exercise suggest about accuracy and precision in the laboratory? OBJECTIVES Measure accurately using typical laboratory equipment. Measure length and mass in SI units. Determine the appropriate number of significant figures for various measurements and calculations. Examine the relationships between measured physical quantities by using graphs and data analysis. MATERIALS LIST 1 rectangular wooden block metric ruler balance meterstick stopwatch Procedure PREPARATION 1. Read the entire lab procedure, and plan the steps you will take. MEASURING LENGTH, WIDTH, THICKNESS, AND MASS 2. Record your data for steps 3–7 in the data table below. Trial 1 Length (cm) Width (cm) Thickness (cm) Mass (kg) Trial 2 Trial 3 Trial 4 Trial 5 Trial 6 Avg Error 3. Use a meterstick to measure the length of the wooden block. Make sure to measure sides. Record all 4. 5. 6. 7. measured digits plus one estimated digit. Follow the same procedure to measure the width and thickness of the block. Repeat all measurements two more times changing the side used each time. Record your data. Carefully adjust the balance to obtain an average zero reading when there is no mass on it. Your teacher will show you how to adjust the balances in your classroom to obtain an average zero reading. Use the balance to find the mass of the block. Record the measurement in your data table. Repeat the mass measurement two more times, and record the values in your data table. Each time, move the block so that it rests on a different side. For trials 4–6, repeat steps 3 through 6 with the second group member making the measurement using a different scale. MEASURING TIME AND DISTANCE 8. Record your data for steps 9–13 in the data table below. Trial Distance Time (s) 1 2 3 4 5 6 Average Error 9. Perform this exercise with a partner. One partner will drop the wooden block from a measured height, and the other partner will measure the time it takes the block to fall to the floor. Perform this in a clear area away from other groups. 10. One student should hold the wooden block straight out in front of him or her at a fixed distance.. Hold the block between your hands. Use the meterstick to measure the height to which the wooden block is raised. Record this distance in your data table. 11. Use the stopwatch to time the fall of the block. Make sure the area is clear, and inform nearby groups that you are about to begin. The student holding the block should release it by pulling both hands straight out to the sides. The student with the stopwatch should begin timing the instant the block is released and stop timing as soon as the block hits the floor. In your data table, record the time required for the block to fall. 12. Repeat for two more trials, recording all data in your data table. Try to drop the block from exactly the same height each time. But measure the height each time. 13. Switch roles, and repeat steps 10 through 12. Perform three trials. Record all data in your data table. 14. Now drop the block from different heights between .5 and 2.5 meters, record time from release to impact and the distance fallen. You will need to make your own table. Analysis 1. Organizing Data Using your data from the first data table, calculate the volume of the wooden block for each trial.. 2. Analyzing Data Use your data from the first table and your results from item 1 above to answer the following questions. a. What is the difference between the smallest length measurement and the largest length measurement? What about for width and thickness. b. What is the difference between the smallest calculated volume and the largest calculated volume? c. Calculate the Volume using the average values of length, width and height. d. Based on your answers to (a), (b), and (c), how does multiplying length measurements together to find the volume affect the precision of the result? 3. Analyzing Data Did the block always fall from the same height in the same amount of time? Explain how you found the answer to this question. Calculate average time and height found and error in measurement. 4. Constructing Graphs Using the data from the 6 different heights in step 14, make a scatter plot of the distance versus the time of the block’s fall. Use a graphing calculator, computer, or graph paper. Find line of best fit and decide if it is a good fit or not. Conclusions 5. Drawing Conclusions For each trial in the first data table, find the ratio between the mass and the volume. Based on your data, what is the relationship between the mass and volume? 6. Evaluating Methods For each type of measurement you made, explain how error could have affected your results. Consider method error and instrument error. How could you find out whether error had a significant effect on your results for each part of the lab? Explain the role of human reaction time in your measurements.
