jfb12062-sup-0001
advertisement

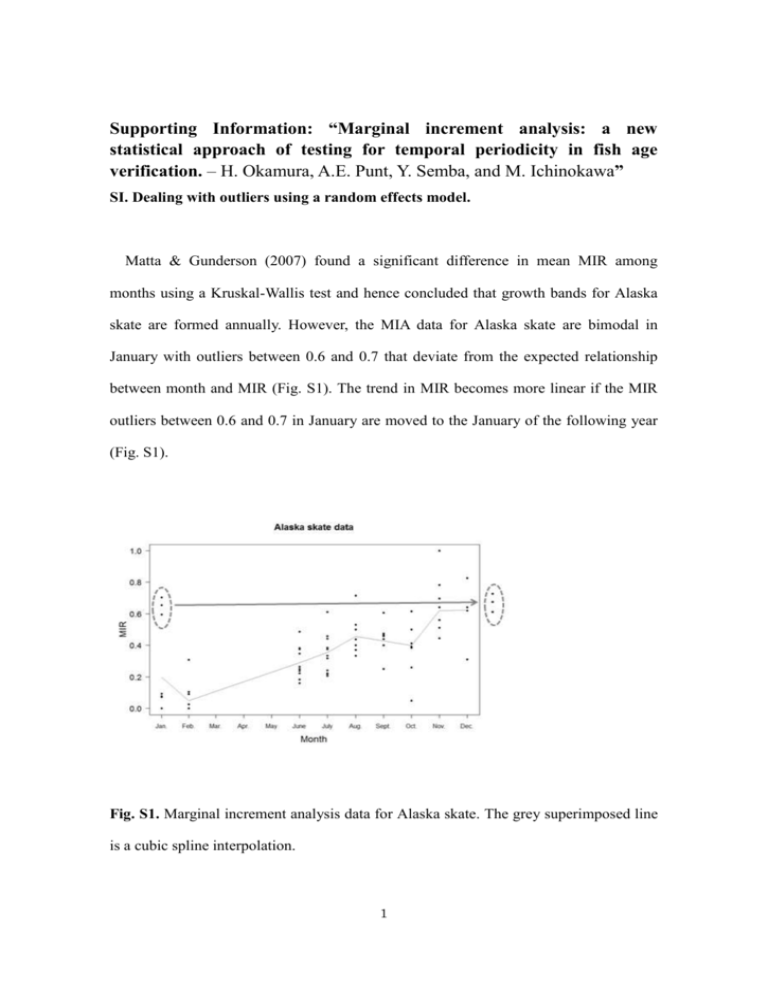
Supporting Information: “Marginal increment analysis: a new statistical approach of testing for temporal periodicity in fish age verification. – H. Okamura, A.E. Punt, Y. Semba, and M. Ichinokawa” SI. Dealing with outliers using a random effects model. Matta & Gunderson (2007) found a significant difference in mean MIR among months using a Kruskal-Wallis test and hence concluded that growth bands for Alaska skate are formed annually. However, the MIA data for Alaska skate are bimodal in January with outliers between 0.6 and 0.7 that deviate from the expected relationship between month and MIR (Fig. S1). The trend in MIR becomes more linear if the MIR outliers between 0.6 and 0.7 in January are moved to the January of the following year (Fig. S1). Fig. S1. Marginal increment analysis data for Alaska skate. The grey superimposed line is a cubic spline interpolation. 1 Fig. S2 illustrates the effects of outliers further. Suppose that the growth band is formed annually. The region between the vertical dotted lines in Fig. S2 shows one year. MIR data only occur in the region between the vertical dotted lines by folding and pooling multiple years. If band formation occurs in January on average, MIRs are expected to follow a straight line from zero in January to one in December. However, individual variation in band formation (e.g. December for Individual 1 and February for Individual 2) will lead to two modes in MIR in January where one mode is around 0 and the other is around 1 (Fig. S2c). MIR a) individual 1 1.0 0.8 0.6 0.4 0.2 0.0 time MIR b) individual 2 1.0 0.8 0.6 0.4 0.2 0.0 time MIR c) individual 1 + individual 2 1.0 0.8 0.6 0.4 0.2 0.0 F M A M J J A S O N D J F M A M J J A S O N D J F M A M J J A S O N D time Fig. S2. Illustration of how outliers can occur. Individuals 1 and 2 have slightly different growth band formation dates. When combining them and folding the plot to one year, there is a probability that outliers occur. The width between vertical dotted lines is one year. 2 One method to handle outliers such as this is to use a circular linear equation with different intersections on abscissa, which are represented by a in terms of the notation in the main text, for each individual. Individual variation can be dealt with using random effects, where parameters are considered as random variables from a specific probability distribution. 3


