section 3.1 solutions
advertisement

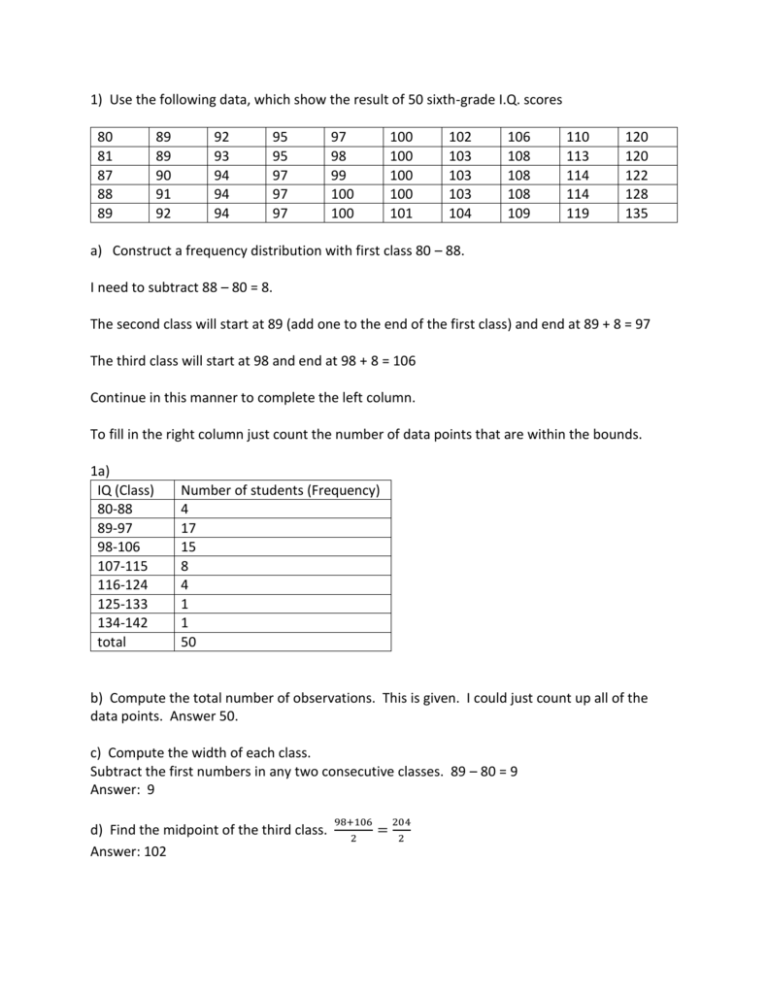
1) Use the following data, which show the result of 50 sixth-grade I.Q. scores 80 81 87 88 89 89 89 90 91 92 92 93 94 94 94 95 95 97 97 97 97 98 99 100 100 100 100 100 100 101 102 103 103 103 104 106 108 108 108 109 110 113 114 114 119 120 120 122 128 135 a) Construct a frequency distribution with first class 80 – 88. I need to subtract 88 – 80 = 8. The second class will start at 89 (add one to the end of the first class) and end at 89 + 8 = 97 The third class will start at 98 and end at 98 + 8 = 106 Continue in this manner to complete the left column. To fill in the right column just count the number of data points that are within the bounds. 1a) IQ (Class) 80-88 89-97 98-106 107-115 116-124 125-133 134-142 total Number of students (Frequency) 4 17 15 8 4 1 1 50 b) Compute the total number of observations. This is given. I could just count up all of the data points. Answer 50. c) Compute the width of each class. Subtract the first numbers in any two consecutive classes. 89 – 80 = 9 Answer: 9 d) Find the midpoint of the third class. Answer: 102 98+106 2 = 204 2 1e) Find the modal class (or classes). This is the class with the highest frequency. Answer: 89 - 97 1f) Find the class limits of the next class if an additional class was added). Answer: 143 - 151 3) The number of goals scored by the Thunderbird Chief’s soccer team of the last 14 games are as follows: 2, 3, 1, 2, 1, 3, 2, 3, 4, 5, 4, 2, 2, 3 Construct a frequency distribution with class width of 1, like in example 1. My left column has to contain a number for each of the unique data points. I will put the numbers 1,2,3,4 and 5 in the left column. I will just count the number of occurrences to fill up the right column. Number of goals scored (Class) 1 2 3 4 5 total Number of times (Frequency) 2 5 4 2 1 14 5) The number of goals scored by the Thunderbird Chief’s soccer team of the last 14 games are as follows: 2, 3, 1, 7, 1, 3, 0, 3, 4, 5, 4, 6, 2, 3 a) Construct a frequency distribution with first class 0-2. The first class is given: 0 – 2 I will start the second class at 3. I need to add 2 to get the end of the second class. The second class will be 3 – 5. I will start the third class at 6. I need to add 2 to get the end of the second class. The second class will be 6 – 8. Number of goals scored (Class) 0-2 3-5 6-8 Total Number of times (Frequency) 5 7 2 14 b) Compute the total number of observations. This is given in the problem. Answer: 14 c) Compute the width of each class. Subtract the first number in two consecutive classes. Answer: 3 – 0 = 3 d) Find the midpoint of the third class. Answer: 7 6+8 2 e) Find the modal class (or classes). Answer: 3 - 5 f) Find the class limits of the next class if an additional class was added). Answer: 9 - 11 7) The community of Anthem is planning to improve the local park. The responses of 18 families who were asked how many times per year they visited the park per year are shown below. Construct a frequency distribution with class width 1. 20 24 25 20 24 26 20 25 26 21 25 26 21 25 27 23 25 28 My left column has to contain a number for each of the unique data points. I will put the numbers 20,21,22,23,24,25,26,27,28 in the left column. I will put a 22 in the distribution, even though there is no 22 in the data. It is not common to skip over a number. Number of visits (Class) 20 21 22 23 24 25 26 27 28 Total Number of families (Frequency) 3 2 0 1 2 5 3 1 1 18 9) The community of Anthem is planning to improve the local park. The responses of 18 families who were asked how many times per year they visited the park per year are shown below. 20 24 28 20 24 28 20 25 29 21 25 30 21 25 31 23 25 32 a) Construct a frequency distribution with first class 20-23. The second class will start at 24, and I will add 3 to get the last number in the second class. The second class will be 24 – 27. The third class will start with 28. I will add 3 to get the last number in the third class. Number of visits (Class) 20-23 24-27 28-31 32-35 Total Number of families (Frequency) 6 6 5 1 18 b) Compute the total number of observations. This is given. I could just add up the numbers in the frequency column. Answer: 18 c) Compute the width of each class. Subtract the first number in any two consecutive classes. 24 - 20 = 4 Answer: 4 28+31 59 d) Find the midpoint of the third class. 2 = 2 Answer: 29.5 e) Find the modal class (or classes). There are two classes that tie for the highest frequency. There are two modal classes. Answer: 20 – 23 and 24 - 27 f) Find the class limits of the next class if an additional class was added). Answer: 36-39


