analysis
advertisement

Performance analysis of different implementations of Proficiency Report
generation (MUI-402)
Implemented and analyzed the performances of a few solutions to the problem of proficiency report generation based
on the chat we had with Seth on 09/01/2011. The idea is coming up with different solutions using different levels of
database querying via SQL and procedural processing in C#, and comparing the performances of these different
solutions.
Performance analysis is done on databases populated with sample data containing different number of users and
sessions (50, 100, and 600 users with 10 sessions/exercise or 100 sessions/exercise). During the analysis, individual
speeds of three different sets of operations were measured and recorded. These three different sets of operations are
performed from the time the user clicks on “Generate Report” button until the resulting table is displayed. They are
defined as the following:
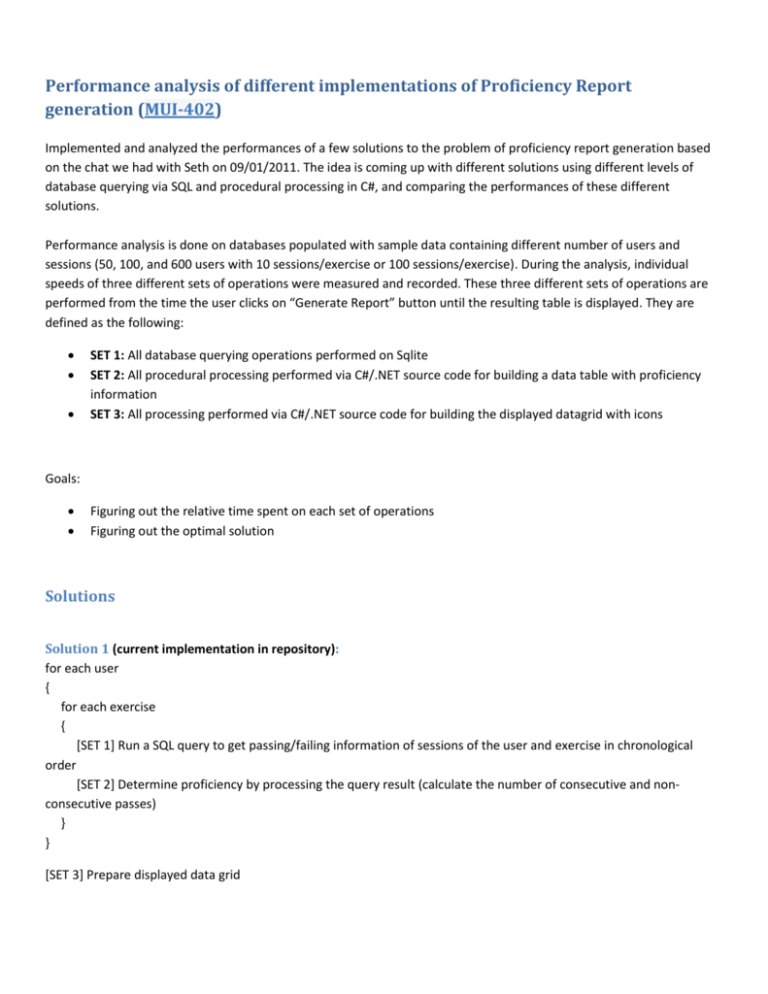
SET 1: All database querying operations performed on Sqlite
SET 2: All procedural processing performed via C#/.NET source code for building a data table with proficiency
information
SET 3: All processing performed via C#/.NET source code for building the displayed datagrid with icons
Goals:
Figuring out the relative time spent on each set of operations
Figuring out the optimal solution
Solutions
Solution 1 (current implementation in repository):
for each user
{
for each exercise
{
[SET 1] Run a SQL query to get passing/failing information of sessions of the user and exercise in chronological
order
[SET 2] Determine proficiency by processing the query result (calculate the number of consecutive and nonconsecutive passes)
}
}
[SET 3] Prepare displayed data grid
Solution 2
for each user
{
[SET 1] Run a SQL query to get passing/failing information of sessions of all exercises of the user in chronological
order
for each exercise
{
[SET 2] Determine proficiency by processing the query result for calculating the number of consecutive and nonconsecutive passes of the exercise
}
}
[SET 3] Prepare displayed data grid
Solution 3
for each exercise
{
[SET 1] Run a SQL query to get passing/failing information of sessions of the exercise of all users in chronological
order
for each user
{
[SET 2] Determine proficiency by processing the query result for calculating the number of consecutive and nonconsecutive passes of the user
}
}
[SET 3] Prepare displayed data grid
Solution 4
[SET 1] Run a SQL query to get passing/failing information of sessions of all exercises of all users in chronological order
for each user
{
for each exercise
{
[SET 2] Determine proficiency by processing the query result for calculating the number of consecutive and nonconsecutive passes of the user and the exercise
}
}
[SET 3] Prepare displayed data grid
Performances
Solution 1
10 sessions/exercise
total time (sec)
50 users & 39 exercises
100 users & 39 exercises
600 users & 39 exercises
6.5
12.16
70
100 sessions/exercise
total time (sec)
50 users & 39 exercises
100 users & 39 exercises
600 users & 39 exercises
30.78
62.72
345.5
SET 1
time
%
3.976
61.16923077
8.270827 68.01666941
51.871
74.10142857
SET 2
time
%
1.452
22.33846154
2.905173 23.89122533
17.107
24.43857143
SET 1
time
28.17
58.455
325.5
%
91.52046784
93.19993622
94.21128799
SET 3
time
1.072
0.984
1.022
SET 2
time
1.585
2.98
17.778
%
5.149447693
4.75127551
5.145586107
%
16.49230769
8.092105263
1.46
SET 3
time
1.025
1.285
2.222
%
3.33008447
2.048788265
0.643125904
Solution 2
10 sessions/exercise
total time (sec)
50 users & 39 exercises
100 users & 39 exercises
600 users & 39 exercises
3.13
5.25
27.63
100 sessions/exercise
total time (sec)
50 users & 39 exercises
100 users & 39 exercises
600 users & 39 exercises
21.03
41.88
266
SET 1
time
1.861
3.824
24.635
%
59.45686901
72.83809524
89.16033297
SET 2
time
0.174
0.34
1.732
SET 1
time
19.156
39.338
254.454
%
91.08892059
93.93027698
95.6593985
%
5.559105431
6.476190476
6.268548679
SET 3
time
1.095
1.086
1.263
SET 2
time
0.736
1.453
10.143
%
34.98402556
20.68571429
4.57111835
SET 3
%
3.499762244
3.469436485
3.813157895
time
1.138
1.089
1.403
SET 1
SET 2
time
%
time
%
1.2412482 50.25296356 0.2777518 11.24501215
2.8992899 59.16918163 0.9777101 19.95326735
17.9797978 34.28641838 33.2702022 63.44432151
time
0.951
1.023
1.19
%
5.411317166
2.600286533
0.527443609
Solution 3
10 sessions/exercise
total time (sec)
50 users & 39 exercises
100 users & 39 exercises
600 users & 39 exercises
2.47
4.9
52.44
100 sessions/exercise
total time (sec)
50 users & 39 exercises
100 users & 39 exercises
600 users & 39 exercises
17.12
36.28
393.42
SET 1
time
14.679
29.791
184.431
%
85.74182243
82.11411246
46.87890804
SET 3
SET 2
time
1.397
5.325
208.006
%
38.50202429
20.87755102
2.269260107
SET 3
%
8.160046729
14.67750827
52.87123176
time
1.044
1.164
0.983
SET 1
SET 2
time
%
time
%
1.2610721 10.13723553 10.1299279 81.43028859
2.5141439 6.163628095 37.0068561 90.72531527
time
1.049
1.269
SET 1
time
%
13.1327511 17.99007
time
1
%
6.098130841
3.208379272
0.2498602
Solution 4
10 sessions/exercise
total time (sec)
50 users & 39 exercises
100 users & 39 exercises
12.44
40.79
100 sessions/exercise
total time (sec)
50 users & 39 exercises
73
SET 2
time
%
58.8672489 80.64006699
SET 3
%
8.432475884
3.111056632
SET 3
%
1.369863014
Analysis
Notes:
There are 39 scored exercises (i.e., the exercises a user can be proficient) in dV-Trainer and the number of
scored exercises is likely going keep being a bounded finite number.
The number of users and number of sessions performed in an exercise are unbounded.
Relative time spent on each set of operations
The fraction of the total time spent on each set of operations heavily depends on the solution.
For example, the majority of time is spent on SET 1 operations in Solution 2. Solution 2 performs database query
operations (SET 1) per each user in a loop. The fraction of time spent on SET 1 operations in Solution 2 increases as the
number of users increases in a dataset (see Solution 2’s performance chart), while the fraction of time spent on SET 2
operations is bounded by the bounded number of exercises.
On the other hand, Solution 4 spends the majority of time on SET 2 operations.
The actual time spent on SET 3 operations is independent from the solution for the same number of users and increases
as the number of users increase (the users are the rows of the data grid). However, the actual time spent on SET 3
operations become insignificant compared to the time spent on other operations as the data set size increases both in
terms of number of users and number of sessions per exercise.
Optimal solution
Solution 4 proved to be the slowest solution from the very first couple data sets compared to all other solutions and
required no further data collection for other data sets.
Both Solutions 2 and 3 are faster than Solution 1 on 50 users and 100 users data sets with 10 and 100 sessions per
exercise. However, it also looks like the speed of Solutions 2 and 3 approaches to that of Solution 1 as the number of
users increase in a data set.
Practically speaking, a dataset of 600 users with 100 sessions per exercise can be assumed to be a pretty good upper
bound on the data that can be generated over the lifetime of dV-Trainer 1.1. For varying sized data sets up to this size,
Solution 2 is the fastest solution.
P.S. I also looked into optimizing the sql query I am using for getting session pass/fail information. I especially looked for
unnecessary table joins (like pointed out in MUI-438) but could not find any.


