- CafeMocha
advertisement
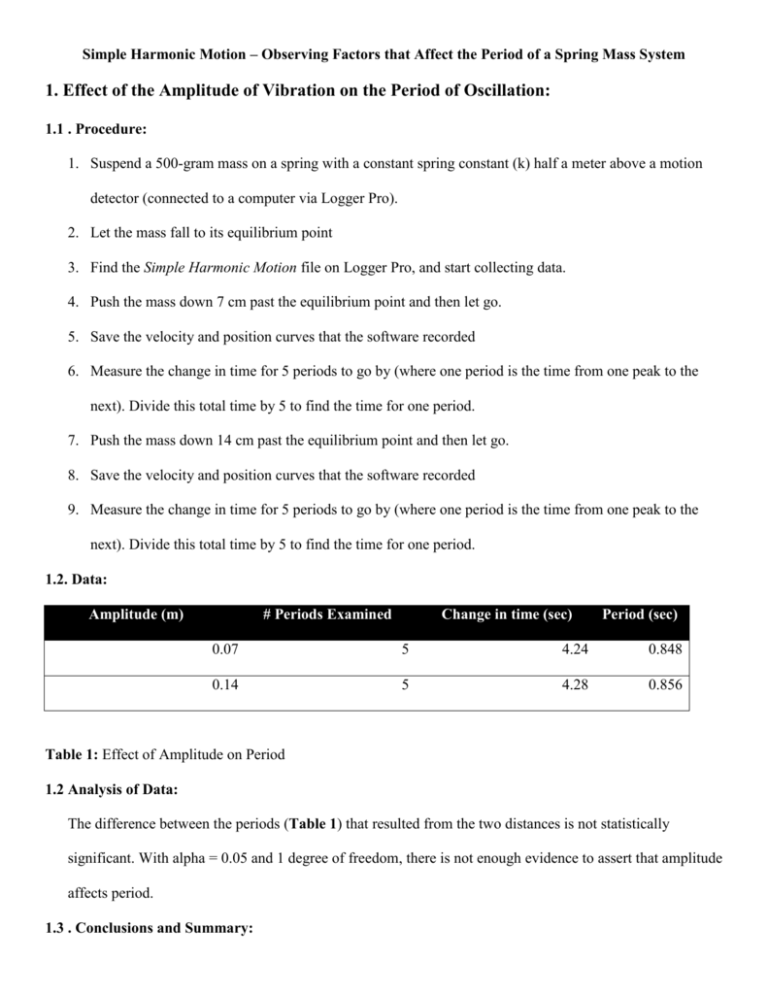
Simple Harmonic Motion – Observing Factors that Affect the Period of a Spring Mass System 1. Effect of the Amplitude of Vibration on the Period of Oscillation: 1.1 . Procedure: 1. Suspend a 500-gram mass on a spring with a constant spring constant (k) half a meter above a motion detector (connected to a computer via Logger Pro). 2. Let the mass fall to its equilibrium point 3. Find the Simple Harmonic Motion file on Logger Pro, and start collecting data. 4. Push the mass down 7 cm past the equilibrium point and then let go. 5. Save the velocity and position curves that the software recorded 6. Measure the change in time for 5 periods to go by (where one period is the time from one peak to the next). Divide this total time by 5 to find the time for one period. 7. Push the mass down 14 cm past the equilibrium point and then let go. 8. Save the velocity and position curves that the software recorded 9. Measure the change in time for 5 periods to go by (where one period is the time from one peak to the next). Divide this total time by 5 to find the time for one period. 1.2. Data: Amplitude (m) # Periods Examined Change in time (sec) Period (sec) 0.07 5 4.24 0.848 0.14 5 4.28 0.856 Table 1: Effect of Amplitude on Period 1.2 Analysis of Data: The difference between the periods (Table 1) that resulted from the two distances is not statistically significant. With alpha = 0.05 and 1 degree of freedom, there is not enough evidence to assert that amplitude affects period. 1.3 . Conclusions and Summary: The distance stretched (amplitude of vibration) does not affect the period of the simple harmonic motion. The difference between .848 and .856 seconds is not statistically significant and can be attributed to chance. 1.4 : Sources of Error: Because of time limitations, only one trial was done. If they were done, there would be an even less significant difference between the periods resulting between the amplitudes. Additionally, more amplitudes could have been tested examined to further support the conclusions. 2. Investigating the effects of spring constant on the period of vibration of a spring mass system: 2.1. Purpose: In section one, it was demonstrated that the amplitude in simple harmonic motion doesn’t affect the period of motion. In section two, the effect of differing spring constant on the period of simple harmonic motion is being determined. Furthermore, the equation relating the two is being derived. 2.2. Hypothesis As the spring constant increases, the period decreases; this is because as spring constant increases, the restoring force exerted by the spring will increase, and so the period—the amount of time to complete one cycle—will decrease. 2.3 Background knowledge: Part 1 of this experiment demonstrated that the amplitude of SHM does not influence the period of motion. Additionally, a knowledge of connecting springs in series and parallel was known; for example, if the experimenter attaches two springs each with spring constant k in series, the resulting spring constant of the one resulting spring will be k/2. On the other hand, when connected in parallel, the resulting spring constant will be 2k. 2.4 Procedure: 1. Suspend a 500-gram mass on a spring with a constant spring constant (k) half a meter above a motion detector (connected to a computer via Logger Pro). 2. Let the mass fall to its equilibrium point 3. Find the Simple Harmonic Motion file on Logger Pro, and start collecting data. 4. Push the mass down 7 cm past the equilibrium point and then let go. 5. Save the velocity and position curves that the software recorded 6. Measure the change in time for 5 periods to go by (where one period is the time from one peak to the next). Divide this total time by 5 to find the time for one period. 7. Repeat steps 1-6 for two springs in series, three springs in series, and two springs in parallel, using the same 500 gram mass. 2.5. Data Collection and Calculation: k # of periods examined Change in time (sec) Period (sec) k 7 5.938 0.8482 k/2 5 6.211 1.242 k/3 4 6.035 1.509 2k 8 4.879 0.6099 Table 2: Effect of k, spring constant, on the period of simple harmonic motion. Period vs. Spring Constant in SHM Period vs. Negative Root of Spring Constant in SHM 1.6 1.6 1.4 1.4 1.2 1.2 T = 0.8623k-0.511 R² = 0.99905 1 Period (seconds) Period (second) k^ (-1/2) 1.000k 1.414k 1.732k 0.7071k 0.8 0.6 1 0.8 T = 0.8875k(-1/2) - 0.0244 R² = 0.99902 0.6 0.4 0.4 0.2 0.2 0 0 0 0.5 1 1.5 2 Spring constant k (relative) 2.5 0.6 0.8 1 1.2 1.4 1.6 Negative root of k (k^(-1/2)) (relative) 1.8 Figure 1: Unstandardized (un-linear) chart demonstrating the inverse relationship between the period of SHM and spring constant k. Figure 2: Standardized chart demonstrating the linear relationship between the period of SHM and the negative root of the spring constant k. Note that since the spring constant of the springs used in the experiment were not known, the values graphed on the x-axis for both graphs are relative. For example, at point (2, .6099) on the left graph, the spring constant was 2k whereas at (.5, 1.242), the spring constant was (1/2) k. 2.6. Analysis: Initially, the unstandardized period was graphed against spring constant and the equation T = 0.8623k-0.511 was derived (Figure 1). Since the power of this equation was -1/2, in order to standardize data (make linear), the period was graphed against the inverse root of k (Figure 2). This standardized the data and resulted in an R^2 value of .999902, a very high correlation. A linear regression with alpha = 0.05 and 1 degree of freedom says that there is strong statistical correlation between period and the negative root of k. 2.7. Conclusions: Since period has a strong linear correlation with the negative root of k, it was determined that 𝑇𝛼 1 √𝑘 . After research the literature proved this to be true because 𝑇 = 2𝜋 √𝑚 √𝑘 . The hypothesis was confirmed because there is an inverse relationship between period and spring constant. 2.8. Sources of Error: Because of time limitations, only one trial was done; more data points would have resulted in more accurate and precise results and would have increased the correlation constant between period and the inverse square of period. Additionally, an equal number of periods was not measured for each trial done; for example, with k=k, the period was averaged between 7 total periods, but for k = k/3, the period was averaged between 4 total periods. Moreover, an equal number of parallel spring and series spring tests were not done; 3 series trials were done and 1 parallel trial was done. Both of these factors skewed the results can could have lead to incorrect data. 2.9. Additional Insights gained though Discussion: Although no literal “class discussion” was done, the instructor pointed out that the experimenters had switched k and T when standardizing the data into a linear fit. This prompted the experimenters to correct the mistake. Outside of that, no discussion was done.

