mec13181-sup-0010-DataS1
advertisement
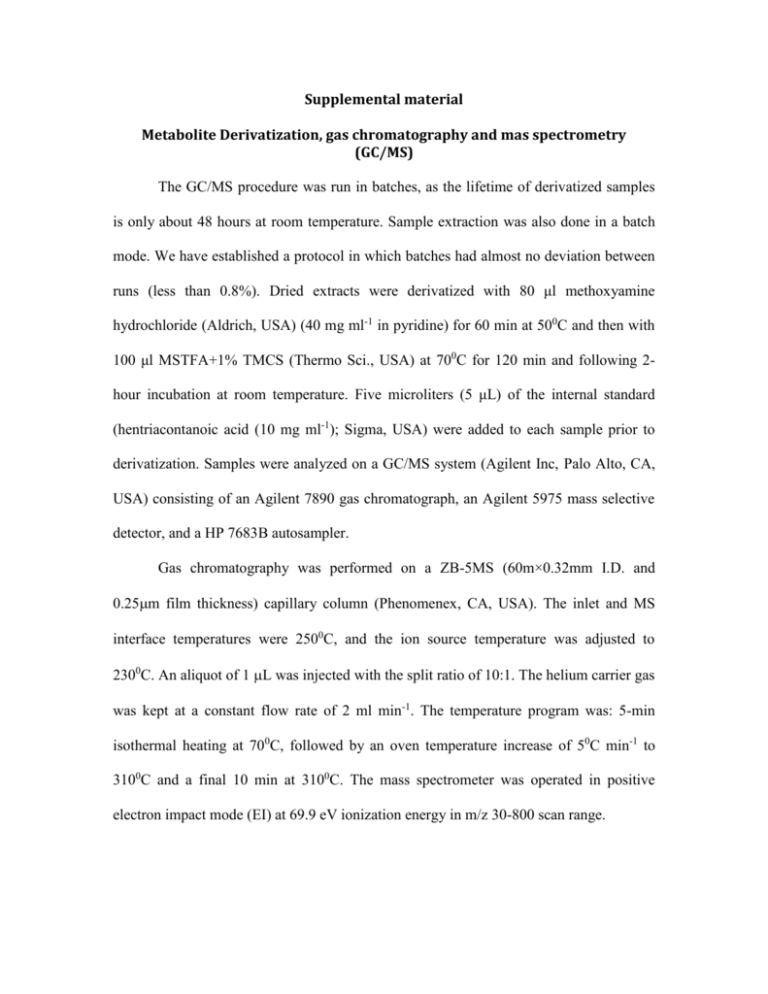
Supplemental material Metabolite Derivatization, gas chromatography and mas spectrometry (GC/MS) The GC/MS procedure was run in batches, as the lifetime of derivatized samples is only about 48 hours at room temperature. Sample extraction was also done in a batch mode. We have established a protocol in which batches had almost no deviation between runs (less than 0.8%). Dried extracts were derivatized with 80 μl methoxyamine hydrochloride (Aldrich, USA) (40 mg ml-1 in pyridine) for 60 min at 500C and then with 100 μl MSTFA+1% TMCS (Thermo Sci., USA) at 700C for 120 min and following 2hour incubation at room temperature. Five microliters (5 μL) of the internal standard (hentriacontanoic acid (10 mg ml-1); Sigma, USA) were added to each sample prior to derivatization. Samples were analyzed on a GC/MS system (Agilent Inc, Palo Alto, CA, USA) consisting of an Agilent 7890 gas chromatograph, an Agilent 5975 mass selective detector, and a HP 7683B autosampler. Gas chromatography was performed on a ZB-5MS (60m×0.32mm I.D. and 0.25m film thickness) capillary column (Phenomenex, CA, USA). The inlet and MS interface temperatures were 2500C, and the ion source temperature was adjusted to 2300C. An aliquot of 1 L was injected with the split ratio of 10:1. The helium carrier gas was kept at a constant flow rate of 2 ml min-1. The temperature program was: 5-min isothermal heating at 700C, followed by an oven temperature increase of 50C min-1 to 3100C and a final 10 min at 3100C. The mass spectrometer was operated in positive electron impact mode (EI) at 69.9 eV ionization energy in m/z 30-800 scan range. Supplemental figure legends Figure S1. Gut bacterial community composition of western lowland gorillas at the phylum (a) and genus (b) levels. Figure S2. Gut bacterial community composition in 4 gorilla groups. (a) Average pair-wise Bray-Curtis dissimilarity within (left side) and between (right side) groups. Different letters denote significant differences (Tukey’s adjusted pair-wise comparisons, P<0.05). (b) Principal coordinate analyses based on Jaccard dissimilarity matrices and showing community composition differences at species level (97% 16S rRNA sequence similarity) between the 4 groups. H1 (red circles), H2 (cyan squares), U1 (blue diamonds) and U2 (gray triangles). Number of reads in each sample is rarefied to 3,756. (c) Statistics for the partition around medoids (PAM) clustering analysis showing that microbiome composition is best described in two or three clusters. Average silhouette width for two clusters=0.077, three clusters=0.081, four clusters=0.055 and 5 clusters =0.061. Figure S3. Correlations between the relative abundance of indicator taxa and PCoA scores from SCFA ordination patterns. The PCoA was done based on a Bray-Curtis dissimilarity matrix. For this analysis, only samples with matching SCFA and microbiome data were used. For this reason the number of samples in each plot is fewer for H2, U1 and U2 (see methods) and the percent variation explained by coordinate one is now 37.2%. Figure S4. Network view of linear relationships between microbiome and metabolome markers in fecal samples of 4 western lowland gorilla groups. Each letter represents sub-networks obtained based on the Fruchterman-Rheingold layout as applied in cytoscape. This force directed algorithm, in which nodes have stronger repulsive force from distant nodes, allows for detection of connected subnetworks. Edges represent Spearman correlation coefficient, rho≥ 0.5 (FDR-q <0.05). Edge thickness shows correlation strength (0.5<rho<0.97). Node size is correlated to degree of connectivity and color nodes correspond to either metabolites (yellow) or bacterial taxa (green). Figure S5. Hierarchically-clustered heatmap showing Spearman correlation values between metabolites and bacterial taxa in fecal samples of 4 western lowland gorilla groups. Clustering was performed based using the heatmap.2 function in gplots (R). The Spearman Correlation matrix and FDR-q values can be seen in table S4. Table S1. Significant indicator values and relative abundances of taxa within groups. +P<0.1; *P<0.05, **P<0.01, denote significant differences according to Kruskal-Wallis pairwise tests adjusted for multiple comparisons. Taxa are compared to the group displaying highest abundance of indicator taxa (colored and in bold). Table S2 Discriminant metabolites characterizing the fecal metabolomes H2 and U2. Z-scores denote discriminant metabolites as identified by the EBAM procedure (6.98-0.8 =FDR< 0.057). Table S3. Network statistics for subnetworks characterizing H1-U1 and H2-U2. Table S4. Spearman correlation matrix and FDR-q values of metabolitemicrobiome relationships.

