Chapter 8 Book Answers
advertisement
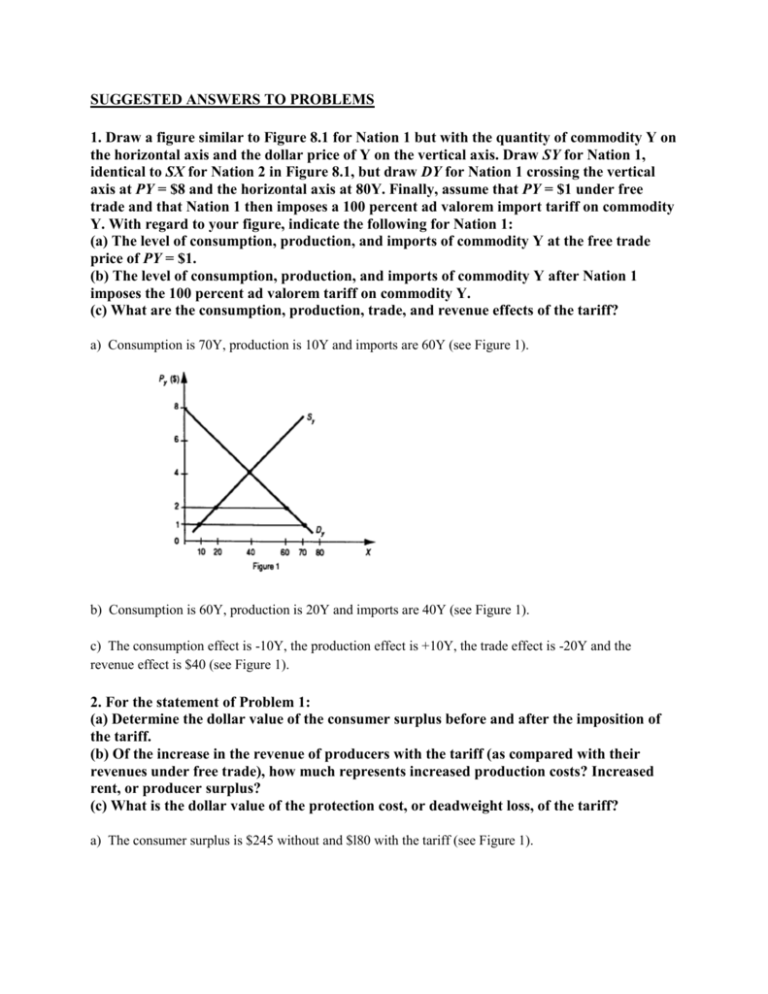
SUGGESTED ANSWERS TO PROBLEMS 1. Draw a figure similar to Figure 8.1 for Nation 1 but with the quantity of commodity Y on the horizontal axis and the dollar price of Y on the vertical axis. Draw SY for Nation 1, identical to SX for Nation 2 in Figure 8.1, but draw DY for Nation 1 crossing the vertical axis at PY = $8 and the horizontal axis at 80Y. Finally, assume that PY = $1 under free trade and that Nation 1 then imposes a 100 percent ad valorem import tariff on commodity Y. With regard to your figure, indicate the following for Nation 1: (a) The level of consumption, production, and imports of commodity Y at the free trade price of PY = $1. (b) The level of consumption, production, and imports of commodity Y after Nation 1 imposes the 100 percent ad valorem tariff on commodity Y. (c) What are the consumption, production, trade, and revenue effects of the tariff? a) Consumption is 70Y, production is 10Y and imports are 60Y (see Figure 1). b) Consumption is 60Y, production is 20Y and imports are 40Y (see Figure 1). c) The consumption effect is -10Y, the production effect is +10Y, the trade effect is -20Y and the revenue effect is $40 (see Figure 1). 2. For the statement of Problem 1: (a) Determine the dollar value of the consumer surplus before and after the imposition of the tariff. (b) Of the increase in the revenue of producers with the tariff (as compared with their revenues under free trade), how much represents increased production costs? Increased rent, or producer surplus? (c) What is the dollar value of the protection cost, or deadweight loss, of the tariff? a) The consumer surplus is $245 without and $l80 with the tariff (see Figure 1). b) Of the increase in the revenue of producers with the tariff (as compared with their revenues under free trade), $l5 represents the increase in production costs and another $15 represents the increase in rent or producer surplus (see Figure 1). c) The dollar value or the protection cost of the tariff is $l0 (see Figure 1). 3. Suppose that a nation reduces import tariffs on raw materials and intermediate products but not on finished products. What effect will this have on the rate of effective protection in the nation? This will increase the rate of effective protection in the nation. *4. Calculate the rate of effective protection when t (the nominal tariff on the final commodity) is 40 percent, ai (the ratio of the cost of the imported input to the price of the final commodity in the absence of tariffs) is 0.5, and ti (the nominal tariff on the imported input) is 40 percent. g = 0.4 - (0.5)(0.4) = 0.4 - 0.2 = 0.2 = 40% 1.0 - 0.5 0.5 0.5 5. For the given in Problem 4, recalculate g with the following values of ti: (a) ti = 20 percent. (b) ti = 0. (c) ti = 80 percent. (d) ti = 100 percent. a) g=60% b) g=80% c) g=0 d) g=20% 6. For the given in Problem 4, (a) Recalculate g if ti = 20 percent and ai = 0.6. (b) What general conclusion can you reach about the relationship between g and t from your answer to Problem 4 in Chapter 3 and Problem 6(a) above? a) g=70% b) See the first paragraph of section 8.3b. *7. Starting with the trade model of Figure 3.4 for Nation 1 and assuming that Nation 1 is small, draw a figure analogous to Figure 8.5 showing the general equilibrium effects resulting when Nation 1 imposes a 100 percent ad valorem import tariff on commodity Y, starting from its free trade position. (Hint: See Figure 4.3but assume that, with the tariff, individuals exchange 30X for 15Y, instead of the 40X for 20Y in Figure 4.3.) See Figure 2. *8. Using the Stolper–Samuelson theorem, indicate the effect on the distribution of income between labor and capital in Nation 1 (assumed to be a small nation) when it imposes an import tariff on commodity Y. When Nation 1 (assumed to be a small nation) imposes an import tariff on commodity Y, the real income of labor falls and that of capital rises. 9. Explain the forces at work that lead to the redistribution of income in your answer to Problem 8, in a way analogous to the explanation given in Section 8.4c for the redistribution of income in Nation 2 when that nation imposed an import tariff on commodity X. Py/Px rises for domestic producers and consumers. As production of Y (the K-intensive commodity) rises and that of X falls, the demand and income of K rises and that of L falls. Therefore, r rises and w falls. 10. How would the result in Problem 8 be affected if Nation 1 were instead assumed to be a large nation? If Nation 1 were instead a large nation, then Nation 1's terms of trade rise and the real income of L may also rise. 11. Is India more likely to restrict its imports of L-intensive or K-intensive commodities? Why? What effect is this likely to have on the distribution of income between labor and capital in India? India is more likely to restrict imports of K-intensive commodities in which India has a comparative disadvantage and this is likely to increase the return to capital and reduce the return to labor according to the Stolper-Samuelson theorem. 12. Starting with the free trade offer curve of Nation 1 and Nation 2 in Figure 8.6 and building on your figure in Problem 1, draw a figure analogous to Figure 8.6 showing the general equilibrium effects of the 100 percent ad valorem import tariff on commodity Y imposed by Nation 1, now assumed to be a large nation. See Figure 3. 13. Draw a figure analogous to Figure 8.7 for Nation 1 showing that with the optimum tariff Nation 1 will trade 25X for 40Y and also showing the effect of Nation 2 retaliating with an optimum tariff of its own. See Figure 4. 14. What happens if the two nations retaliate against each other’s optimum tariff several times? The volume of trade may shrink to zero (the origin of offer curves). *= Answer provided at www.wiley.com/college/salvatore. SUGGESTED ANSWERS TO PROBLEMS IN APPENDIX A8.1 Problem What is the relationship between the price elasticity of SH and SF and the price of the commodity under free trade and with the specific tariff? The more elastic SH and SF are, the lower is the free trade price of the commodity and the lower is the increase in the domestic price of the commodity as a result of the tariff. A8.2 Problem (a) What effect will the imposition of a tariff on imported inputs going into the domestic production of a commodity have on the size of the consumption, production, trade, revenue, and redistribution effects of the tariff on the final commodity? (b) What effect will it have on the size of the protection cost, or deadweight loss, of the tariff? (Hint: Determine which curve shifts and in which direction in Figure 8.1 as a result of the tariff on imported inputs.) a) The supply curve of the nation for the commodity shifts up and to the left (as with the imposition of any tax); this does not affect the consumption of the commodity with free trade, but it reduces domestic production and increases imports of the commodity; it also increases the revenue effect and reduces producers' surplus. b) The imposition of a tariff on imported inputs going into the domestic production of the commodity will have no effect on the size of the protection cost or deadweight loss. A8.3 Problem Utilizing the Edgeworth box diagram for Nation 1 in the top panel of Figure 3.9 and in Figure 5.6, show that a 100 percent import tariff on commodity Y alters production from point B to point F, reduces K/L in the production of both commodities, and thus increases the productivity and income of capital in Nation 1. See Figure 5 A8.4 Problem Draw a figure analogous to Figure 8.10 showing in the left panel that the Stolper– Samuelson theorem holds when Nation 1 imposes an export tariff and showing the Metzler paradox in the right panel. See Figure 6. A8.5 Problem What effect on real w and r will the imposition of an import tariff on commodity Y (the K-intensive commodity) have in Nation 1 (the L-abundant nation) if labor is mobile but capital is not? Real w will fall in terms of Y and rise in terms of X. On the other hand, real r will rise in terms of Y and fall in terms of X. This can be seen by drawing a figure similar to Figure 8-10, but with the VMPLy curve shifting upward. A8.6 Problem (a) Draw a figure analogous to Figure 8.12 showing the optimum export tariff on commodity X for Nation 1. (Hint: For the general shape of Nation 1’s trade indifference curves, see Figure 4.8.) Can you show on the same figure the optimum tariff for Nation 2 after Nation 1 has already imposed its optimum tariff? (Hint: See Figure 8.7.) (b) What are the approximate terms of trade of Nation 1 and Nation 2 after Nation 1 has imposed an optimum tariff and Nation 2 has retaliated with an optimum tariff of its own? (c) How has the welfare of each nation changed from the free trade position? a) See Figure 7. b) After Nation 1 has imposed an optimum tariff and Nation 2 has retaliated with an optimum tariff of its own, the approximate terms of trade for Nation 1 is 0.8, while the approximate terms of trade of Nation 2 is 1.25. c) Nation 1's welfare declines from the reduction in the volume and in the terms of trade. Although nation 2's terms of trade are higher than under free trade, the volume of trade has shrunk so much that nation 2's welfare is also likely to be lower than under free trade.
