UEP Intro to GIS Final Project Paper
advertisement
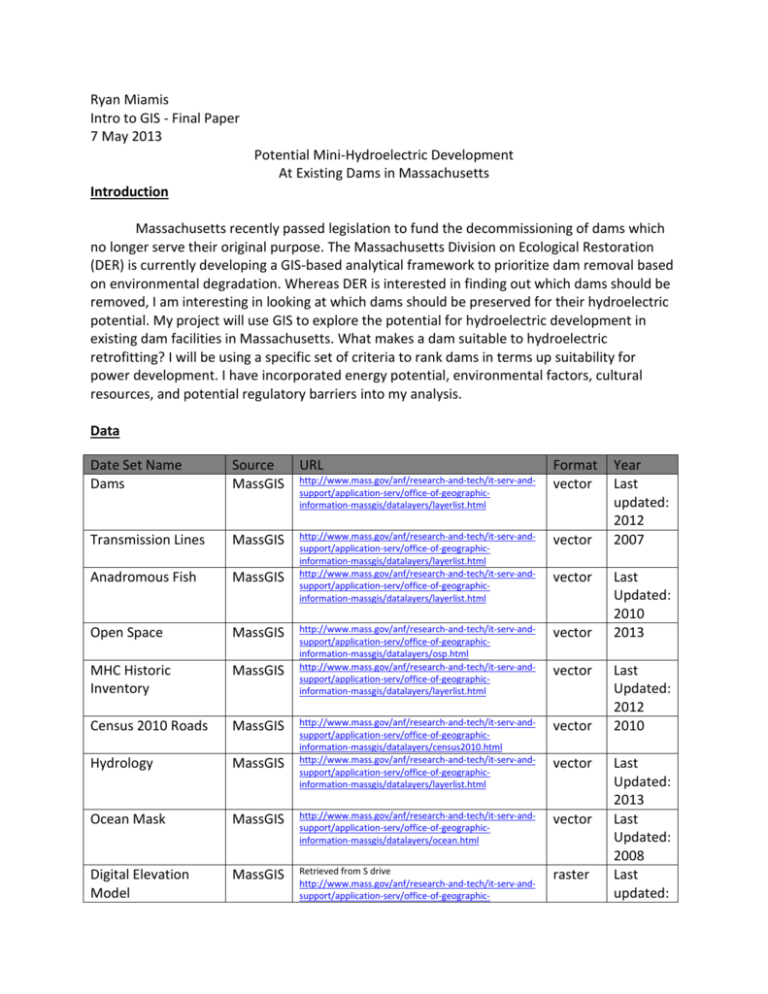
Ryan Miamis Intro to GIS - Final Paper 7 May 2013 Potential Mini-Hydroelectric Development At Existing Dams in Massachusetts Introduction Massachusetts recently passed legislation to fund the decommissioning of dams which no longer serve their original purpose. The Massachusetts Division on Ecological Restoration (DER) is currently developing a GIS-based analytical framework to prioritize dam removal based on environmental degradation. Whereas DER is interested in finding out which dams should be removed, I am interesting in looking at which dams should be preserved for their hydroelectric potential. My project will use GIS to explore the potential for hydroelectric development in existing dam facilities in Massachusetts. What makes a dam suitable to hydroelectric retrofitting? I will be using a specific set of criteria to rank dams in terms up suitability for power development. I have incorporated energy potential, environmental factors, cultural resources, and potential regulatory barriers into my analysis. Data Date Set Name Dams Source MassGIS URL Transmission Lines MassGIS vector Anadromous Fish MassGIS http://www.mass.gov/anf/research-and-tech/it-serv-andsupport/application-serv/office-of-geographicinformation-massgis/datalayers/layerlist.html http://www.mass.gov/anf/research-and-tech/it-serv-andsupport/application-serv/office-of-geographicinformation-massgis/datalayers/layerlist.html Open Space MassGIS vector MHC Historic Inventory MassGIS http://www.mass.gov/anf/research-and-tech/it-serv-andsupport/application-serv/office-of-geographicinformation-massgis/datalayers/osp.html http://www.mass.gov/anf/research-and-tech/it-serv-andsupport/application-serv/office-of-geographicinformation-massgis/datalayers/layerlist.html Census 2010 Roads MassGIS vector Hydrology MassGIS http://www.mass.gov/anf/research-and-tech/it-serv-andsupport/application-serv/office-of-geographicinformation-massgis/datalayers/census2010.html http://www.mass.gov/anf/research-and-tech/it-serv-andsupport/application-serv/office-of-geographicinformation-massgis/datalayers/layerlist.html Ocean Mask MassGIS http://www.mass.gov/anf/research-and-tech/it-serv-andsupport/application-serv/office-of-geographicinformation-massgis/datalayers/ocean.html vector Digital Elevation Model MassGIS Retrieved from S drive http://www.mass.gov/anf/research-and-tech/it-serv-andsupport/application-serv/office-of-geographic- raster http://www.mass.gov/anf/research-and-tech/it-serv-andsupport/application-serv/office-of-geographicinformation-massgis/datalayers/layerlist.html Format vector vector vector vector Year Last updated: 2012 2007 Last Updated: 2010 2013 Last Updated: 2012 2010 Last Updated: 2013 Last Updated: 2008 Last updated: information-massgis/datalayers/imgelev5k.html 2005 *Most of the datalayers are relatively static by nature so the “year in which the data represents” is not applicable. Data Preparation and Analysis All of my data is from the MassGIS datalayers source and is already clipped to Massachusetts and projected onto AD_1983_StatePlane_Massachusetts_Mainland_FIPS_2001. To determine if a dam’s potential for hydroelectric retrofitting, I developed two screenings, elimination and ranking phases, for dam assessment. In the first screening, dams were eliminated from my analysis based on multiple criteria. Dams under Federal Energy Regulatory Commission (FERC) were removed because they are already producing hydroelectric power. Additionally, dams with no jurisdiction were removed as these structures are typically less than 6 feet in height and have poor potential for power development. Next, I eliminated dams that were in areas with strict development regulations. Any dam in protected open space and preservation land was removed. Using cultural resource data from the Massachusetts Historical Commission, I eliminated historical dams and dams in historical districts. The last elimination criterion is tidal dams and dams in coastal regions. There were two reasons for this: (1) tidal power development should be evaluated separately form mini-hydroelectric power and (2) the Massachusetts coastal region is a significant cultural and environmental area where resources such as river spawning fish habitats are targeted for restoration. This process eliminated twothirds of Massachusetts’s 3000 dams. With about 900 dams remaining in my analysis, I developed a second screening. This stage ranked each dam’s suitability for mini-hydroelectric power development based on distances to transmission lines and access roads and also slopes of the land at the dam site. A short distance to transmission lines is important for getting electric power to the grid. A short distance to roads is important for access to the dam for construction vehicles to construct the retrofit. A higher slope does not necessarily equate to higher energy potential, however due to insufficient data on dam size and potential capacity; slope was selected as the best available criteria to judge energy potential. Attributes were ranked on a scale of 1 to 5 with 5 being most suitable for development. Dams with the highest scores on each of the criteria will be prioritized for mini-hydroelectric power development. Key Steps Dams - select out by attribute when regulatory authority = “FERC Jurisdiction” or “Nonjurisdictional/other” Transmission Lines o Select by attribute when code = “transmission lines” or “substation” o Near tool – find distance of dams from transmission lines Rank distance: 100= greater than 8000m, 200=1000-8000m, 300= 2501000m, 400=less than 250m Anadromous Fish o Buffer tool- create 2km buffer o Select out by location, dams in this buffer zone Ocean Mask o Buffer tool – create 10km buffer zone o Select out by location, dams in this buffer zone MHC Historic Inventory o Find and Replace Tool – keyword search for “dam” and document Buffer tool – create 10m buffer around each historical“dam” point to account for misplacement of dam layer and MHC layer Select out by location, dams that are located in the buffer zone Open Space – select out by location, dams in these areas Digital Elevation Model o Slope Tool – create slope from elevation layer o Extract Values to Points tool- snap slope values to dam points o Rank slope: 1= less than 5 degrees, 2=5-15 degrees, 3=15-25 degrees, 4= greater than 25 degrees Census 2010 Roads o Near tool – find distance of dams to nearest road Rank distance: 10= greater than 200m, 20=50-200m , 30=10-50m , 40= less than 10m Final Steps: o Summed up slope, transmission lines distance, and road distance ranks o No perfect scores o Best scores were chosen arbitrarily to be 442 & 344 (3 dams total) Results The analysis concludes with the top prioritization of eight dams in the state. Furthermore, I have identified thirty-three additional dam targets for mini-hydroelectric power retrofitting. These dams are located out of strict regulatory and environmental sensitive areas. Dams and their removal have become controversial. This analysis is intended to avoid the common conflict points. Next steps for this analysis will be to conduct site visits to these dams to access their condition and potential capacity. This will begin the process to determine the economic feasibility of mini-hydro. The true potential of mini-hydro in Massachusetts will be evident when combined with this additional data. Relevant Literature Hoenke, Kathleen (2012). A GIS Tool Prioritizing Dams for Removal within the State of North Carolina. (Master’s thesis). Retrieved from: http://dukespace.lib.duke.edu/dspace/bitstream/handle/10161/5337/Hoenke% 20K %20MP%202012.pdf?sequence=1 This has been an extremely useful resource as I develop my project ideas and plan. I am more or less following the same steps in this thesis to conduct my analysis. As the title suggests, this thesis examines dam removal prioritization in North Carolina by using GIS. The author basically developed a toolkit that I am following. She examines environmental and social implications of dam removal which I have chosen to adapt along with energy considerations. She suggests different strategies to weight the different criterion but I will choose my own. This thesis has also help guide me to different resources and reassured me about some of the data layers that I was already considering. Meyer, Tanya, Provencher, Bill, and Sarakinos, Helen (2008). Does Small Dam Removal Effect Affect Local Property Values? An Empirical Analysis. Contemporary Economic Policy 26(2): 187-197. I’m noticing that Helen Sarakinos is some sort of dam removal expert in the Mid-West as she is involved in a few of the literature that I have come across. This study looked at property values over time at three different areas: (1) where a dam was removed, (2) where a dam remains intact, and (3) where a river has been flowing unimpeded for 20 years. The study concludes that property values of waterfront plots do not increase as a result of dam removal although non-waterfront properties near free-flowing waters show an increase in value. This study has steered me away from adding land value and income demographics to my analysis as originally considered in Assignment 1. My thinking was that dams in lowincome areas and areas in need of investment (i.e. abandoned/vacant plots, contaminated parcels, etc.) should be considered a higher priority. This study has led me away from that part of the analysis. Wegener, Mark and Sarakinos, Helen (2005). Improving Selective Dam Removal in Wisconsin. Retrieved from: http://proceedings.esri.com/library/userconf/proc05/papers/pap1550.pdf Traditionally, dam removal was based on the ability to restore river ecosystems, improve fish and wildlife populations, and increase recreational opportunities. This paper examines how GIS can improve selectivity based on predicted ecological benefits of dam removal. The authors provided spatial questions to consider and also some attributes to think of. The questions are: Which rives have highest and lowest density of dams? Which dams affect fisheries habitat? Which dams impact the habitat of species of concern? How much connectivity restored with a given removal? Which removals will impact headwater areas? Which removal will mitigate water quality problems? Which removals are on specially designated rivers? The authors show how to consider these questions and which data layers to use. The other attributes to consider include: ownership status, impoundment size, structure size, purpose of dam, population around impoundment, and last inspection date. I intend on using most of the recommendations in my analysis. Executive Office of Energy and Environmental Affairs (2007). Dam Removal in Massachusetts: A Basic Guide for Project Proponents. Retrieved from: http://www.mass.gov/eea/docs/eea/water/damremoval-guidance.pdf This is a guide for dam removal in Massachusetts, from identifying potential dams to community engagement and funding sources. This document is specific to Massachusetts so it was particularly useful in thinking about the current situation in the state. Most of the attributes that the guide proposes I had already thought of but there were a few that I didn’t. For instance, I never considered dams to be used for road, rail, or other utility crossings. This would ultimately eliminate or significantly decrease their priority for removal. This guide offers a good overview of the initial reconnaissance but does not give specific GIS instructions. However, I still consider it useful. U.S. Department of the Interior, U.S. Department of the Army, and U.S. Department of Energy (2007). Potential Hydroelectric Development at Existing Federal Facilities. Retreved from: http://www.usbr.gov/power/data/1834/Sec1834_EPA.pdf This study was conducted in collaboration with three government agencies. The project examined potential electric conversion at Federal dam facilities across the country. The study was most useful in thinking about what criteria and data I might use to consider dams for electric retrofitting. Among these metrics are stream flow, hydraulic head, and capacity as a result of these attributes. The document also provided a list of screening attributes that would eliminate possible sites for retrofit. These include: National Rivers, National Historic Areas, Wild and Scenic Rivers, National Monuments, and Critical Habitat. This also gave me ideas about where to search for more data. Difficulties Encountered & Conclusion I did not run into too many problems during my project, although I think that might be due to the fact that I had reasonable expectations and tried to keep things simple. I found the online resources, specifically the ArcGIS resources, to be almost completely useless. In order to be able to find the right information you needed to know the tool you wanted to use. I wasn’t sure which ones I needed so searching aimlessly using different keyword failed miserably. Also, the lack of data was clearly an issue. I’m not very confident with my analysis of dam retrofits. I needed to know the size of the dams and the water around it to understand the true hydropower potential. On a side note, the Switch Selection button/option was extremely helpful for me.


