Saras_Candy_Diagram_Intro_Handout
advertisement
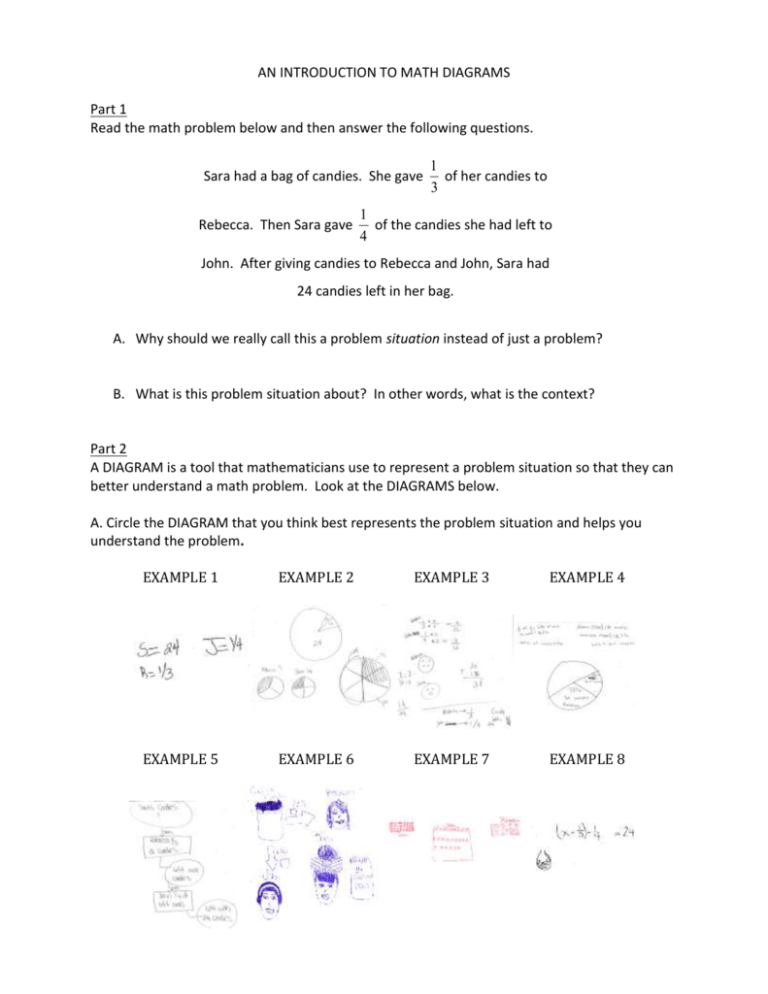
AN INTRODUCTION TO MATH DIAGRAMS Part 1 Read the math problem below and then answer the following questions. Sara had a bag of candies. She gave Rebecca. Then Sara gave 1 of her candies to 3 1 of the candies she had left to 4 John. After giving candies to Rebecca and John, Sara had 24 candies left in her bag. A. Why should we really call this a problem situation instead of just a problem? B. What is this problem situation about? In other words, what is the context? Part 2 A DIAGRAM is a tool that mathematicians use to represent a problem situation so that they can better understand a math problem. Look at the DIAGRAMS below. A. Circle the DIAGRAM that you think best represents the problem situation and helps you understand the problem. EXAMPLE 1 EXAMPLE 2 EXAMPLE 3 EXAMPLE 4 EXAMPLE 5 EXAMPLE 6 EXAMPLE 7 EXAMPLE 8 B. Give up to 5 reasons why you think the diagram you circled helps you understand the problem situation. Reason #1: Reason #2: Reason #3: Reason #4: Reason #5: C. Look at the DIAGRAMs again. Identify the diagram you think is least helpful for understanding the problem. Then complete the following: DIAGRAM # does NOT help me understand the problem because Part 3 A really good DIAGRAM will help you to “see” a way to solve the problem. Suppose the question for the problem above was “HOW MANY CANDIES WERE IN SARA’S BAG TO START?”. A. Which DIAGRAM helps you “see” a solution strategy? DIAGRAM # B. Show or explain that solution strategy. .
