SI_Table_S1_to_S2
advertisement
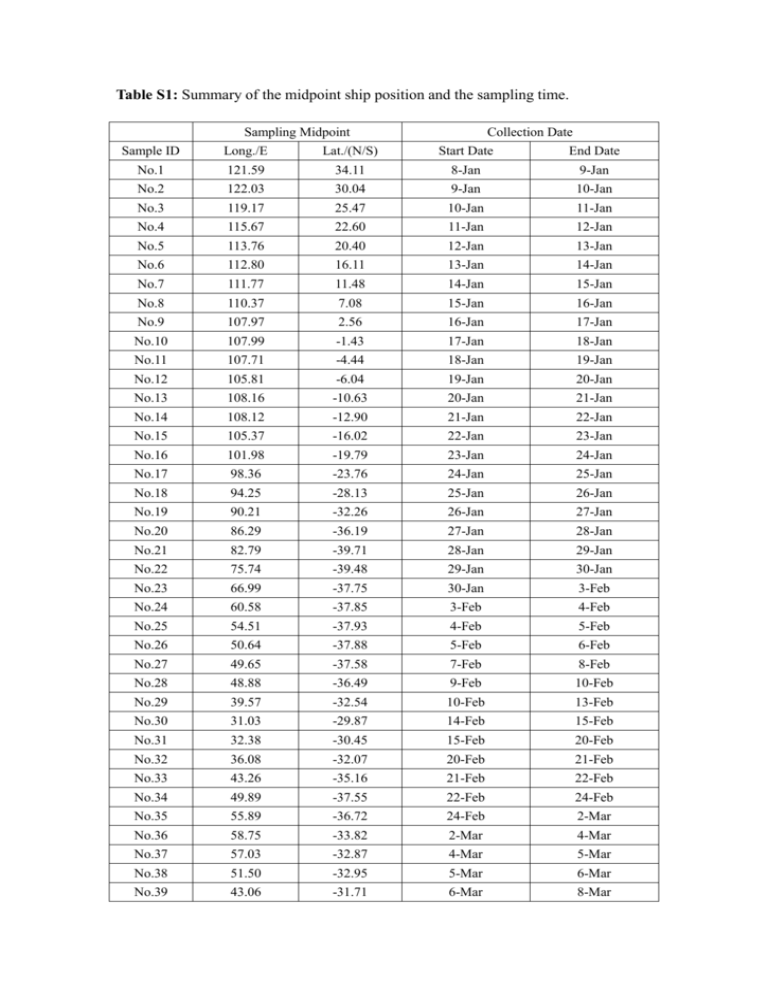
Table S1: Summary of the midpoint ship position and the sampling time. Sampling Midpoint Collection Date Sample ID Long./E Lat./(N/S) Start Date End Date No.1 121.59 34.11 8-Jan 9-Jan No.2 122.03 30.04 9-Jan 10-Jan No.3 119.17 25.47 10-Jan 11-Jan No.4 115.67 22.60 11-Jan 12-Jan No.5 113.76 20.40 12-Jan 13-Jan No.6 112.80 16.11 13-Jan 14-Jan No.7 111.77 11.48 14-Jan 15-Jan No.8 110.37 7.08 15-Jan 16-Jan No.9 107.97 2.56 16-Jan 17-Jan No.10 107.99 -1.43 17-Jan 18-Jan No.11 107.71 -4.44 18-Jan 19-Jan No.12 105.81 -6.04 19-Jan 20-Jan No.13 108.16 -10.63 20-Jan 21-Jan No.14 108.12 -12.90 21-Jan 22-Jan No.15 105.37 -16.02 22-Jan 23-Jan No.16 101.98 -19.79 23-Jan 24-Jan No.17 98.36 -23.76 24-Jan 25-Jan No.18 94.25 -28.13 25-Jan 26-Jan No.19 90.21 -32.26 26-Jan 27-Jan No.20 86.29 -36.19 27-Jan 28-Jan No.21 82.79 -39.71 28-Jan 29-Jan No.22 75.74 -39.48 29-Jan 30-Jan No.23 66.99 -37.75 30-Jan 3-Feb No.24 60.58 -37.85 3-Feb 4-Feb No.25 54.51 -37.93 4-Feb 5-Feb No.26 50.64 -37.88 5-Feb 6-Feb No.27 49.65 -37.58 7-Feb 8-Feb No.28 48.88 -36.49 9-Feb 10-Feb No.29 39.57 -32.54 10-Feb 13-Feb No.30 31.03 -29.87 14-Feb 15-Feb No.31 32.38 -30.45 15-Feb 20-Feb No.32 36.08 -32.07 20-Feb 21-Feb No.33 43.26 -35.16 21-Feb 22-Feb No.34 49.89 -37.55 22-Feb 24-Feb No.35 55.89 -36.72 24-Feb 2-Mar No.36 58.75 -33.82 2-Mar 4-Mar No.37 57.03 -32.87 4-Mar 5-Mar No.38 51.50 -32.95 5-Mar 6-Mar No.39 43.06 -31.71 6-Mar 8-Mar No.40 35.41 -30.50 8-Mar 9-Mar No.41 31.05 -29.84 9-Mar 10-Mar No.42 57.87 -31.18 27-Mar 28-Mar No.43 58.38 -31.22 28-Mar 29-Mar No.44 62.16 -28.86 31-Mar 1-Apr No.45 63.46 -28.06 1-Apr 2-Apr No.46 63.76 -27.90 2-Apr 3-Apr No.47 69.65 -23.98 3-Apr 4-Apr No.48 69.62 -23.98 4-Apr 5-Apr No.49 69.62 -23.92 5-Apr 6-Apr No.50 69.59 -23.93 6-Apr 7-Apr No.51 69.60 -23.99 7-Apr 8-Apr No.52 70.22 -22.81 8-Apr 9-Apr No.53 71.86 -19.49 9-Apr 10-Apr No.54 74.21 -15.30 10-Apr 11-Apr No.55 75.82 -13.08 11-Apr 12-Apr No.56 77.27 -13.83 12-Apr 14-Apr No.57 87.02 -18.52 15-Apr 16-Apr No.58 91.73 -20.86 16-Apr 17-Apr No.59 104.31 -26.79 18-Apr 20-Apr No.60 112.49 -30.61 20-Apr 22-Apr No.61 130.24 -36.76 28-Apr 29-Apr No.62 138.51 -39.46 29-Apr 4-May No.63 168.92 -25.97 4-May 11-May No.64 176.35 -21.28 11-May 16-May No.65 177.34 -21.18 16-May 21-May No.66 178.37 -19.73 21-May 24-May No.67 178.54 -18.72 24-May 28-May No.68 175.33 -12.46 28-May 31-May No.69 167.22 -0.92 31-May 3-Jun No.70 157.17 5.87 3-Jun 6-Jun No.71 152.07 12.00 6-Jun 8-Jun No.72 152.04 17.33 8-Jun 11-Jun No.73 153.67 17.73 11-Jun 14-Jun No.74 155.20 16.78 14-Jun 17-Jun No.75 155.26 15.43 17-Jun 20-Jun No.76 156.67 12.68 23-Jun 26-Jun No.77 156.98 10.97 26-Jun 28-Jun No.78 157.86 8.14 28-Jun 1-Jul No.79 158.22 6.97 1-Jul 2-Jul No.80 159.04 12.32 3-Jul 5-Jul No.81 160.52 21.63 6-Jul 8-Jul No.82 160.60 21.72 8-Jul 10-Jul No.83 160.58 21.68 10-Jul 12-Jul No.84 160.53 21.62 12-Jul 14-Jul No.85 159.18 20.63 14-Jul 16-Jul No.86 157.61 19.84 16-Jul 18-Jul No.87 157.41 19.78 18-Jul 20-Jul No.88 157.70 19.49 20-Jul 22-Jul No.89 157.67 19.63 22-Jul 24-Jul No.90 157.49 19.62 24-Jul 26-Jul No.91 157.45 19.38 26-Jul 28-Jul No.92 152.58 17.48 28-Jul 30-Jul No.93 142.80 15.76 30-Jul 1-Aug No.94 122.24 19.84 3-Aug 5-Aug No.95 115.46 21.63 5-Aug 7-Aug Table S2: Sampling information of the studies cited in this paper for data comparison Flow Rate (m /min) Volume (m ) Sampling Time (hour) keep low (< 0.21) 281/243 for the warm/cold period 24 QFF Akyüz and H. Çabuk (2010) 1.13 4800-5200 72 QFF Caricchia, et al. 1995 1.1 for cascade impactor 1.5 for and bulk sampler --- 12 --- Crimmins, et al. 2004 ∼1.0 1215-3030 --- QFF Ding, et al., 2007 1.0 --- 24 QFF Guo, et al., 2003a 1.13–1.41 --- 24 QFF Guo, et al., 2003b 3 3 Method Literatures 0.25 180 12 QFF He and Balasubramanian, 2009 --- ∼110–190 12 GFF Jaward, et al., 2004 0.23 --- 24 GFF Li et al., 2006 0.10 --- 24 GFF Liu et al., 2007 0.86 650-700 --- GFF Nizzetto et al., 2008 --- 1700 24 TMF Panther et al., 1999 0.016 for PM2.5 0.032 for PM10 --- 23 QFF/TMF Stone et al., 2007 0.10 --- 24 GFF Wu et al., 2005 --- ~220 --- QFF Xu et al., 2012 0.00093 --- ~1.5 GFF Zhang et al., 2008 QFF: Quartz fiber filter GFF: Glass fiber filter TMF: Teflon membrane filter ---: Data was not published References: Akyüz, M., and H. Çabuk (2010), Gas–particle partitioning and seasonal variation of polycyclic aromatic hydrocarbons in the atmosphere of Zonguldak, Turkey, Sci. Total Environ., 408(22), 5550-5558, doi: 10.1016/j.scitotenv.2010.07.063 Caricchia, A. M., S. Chiavarini, C. Cremisini, R. Morabito, A. Perini, and M. Pezza (1995), Determination of PAH in atmospheric particulates in the area of the Italian base in Antarctica: Report on monitoring activities during the last three scientific expeditions, Environ. Pollut., 87(3), 345-356, doi: 10.1016/0269-7491(94)P4166-L. Crimmins, B. S., R. R. Dickerson, B. G. Doddridge, and J. E. Baker (2004), Particulate polycyclic aromatic hydrocarbons in the Atlantic and Indian Ocean atmospheres during the Indian Ocean Experiment and Aerosols99: Continental sources to the marine atmosphere, J. Geophys. Res.-Atmos., 109, D05308, doi: 10.1029/2003JD004192. Ding, X., Wang, X., Xie, Z., Zhang, Z., and Sun, L. (2013), Impacts of Siberian Biomass Burning on Organic Aerosols over the North Pacific Ocean and the Arctic: Primary and Secondary Organic Tracers, Environ, Sci. Technol., 47(7), 3149-3157, doi:10.1021/es3037093. Guo, L. Sheng, J. Feng, and M. Fang (2003a), Seasonal variation of solvent extractable organic compounds in the aerosols in Qingdao, China, Atmos. Environ., 37(13), 1825-1834, doi: 10.1016/S1352-2310(03)00064-5 Guo, S. C. Lee, K. F. Ho, X. M. Wang, and S. C. Zou (2003b), Particle-associated polycyclic aromatic hydrocarbons in urban air of Hong Kong, Atmos. Environ., 37(38), 5307-5317, .doi: 10.1016/j.atmosenv.2003.09.011. He, J., and R. Balasubramanian (2009), A study of gas/particle partitioning of SVOCs in the tropical atmosphere of Southeast Asia, Atmos. Environ., 43(29), 4375-4383, doi: 10.1016/j.atmosenv.2009.03.055. Jaward, F. M., J. L. Barber, K. Booij, and K. C. Jones (2004), Spatial distribution of atmospheric PAHs and PCNs along a north–south Atlantic transect, Environ. Pollut., 132(1), 173-181, doi: 10.1016/j.envpol.2004.03.029. Li, J., G. Zhang, X. D. Li, S. H. Qi, G. Q. Liu, and X. Z. Peng (2006), Source seasonality of polycyclic aromatic hydrocarbons (PAHs) in a subtropical city, Guangzhou, South China, Sci. Total Environ, 355(1–3), 145-155, doi: 10.1016/j.scitotenv.2005.02.042. Liu, S., S. Tao, W. Liu, Y. Liu, H. Dou, J. Zhao, L. Wang, J. Wang, Z. Tian, and Y. Gao (2007), Atmospheric polycyclic aromatic hydrocarbons in North China: a winter-time study, Environ. Sci. Technol., 41(24), 8256-8261, doi: 10.1021/es0716249. Nizzetto, L., R. Lohmann, R. Gioia, A. Jahnke, C. Temme, J. Dachs, P. Herckes, A. D. Guardo, and K. C. Jones (2008), PAHs in Air and Seawater along a North–South Atlantic Transect: Trends, Processes and Possible Sources, Environ. Sci. Technol., 42(5), 1580-1585, doi: 10.1021/es0717414. Panther, B., M. Hooper, and N. Tapper (1999), A comparison of air particulate matter and associated polycyclic aromatic hydrocarbons in some tropical and temperate urban environments, Atmos. Environ., 33(24), 4087-4099, doi: 10.1016/S1352-2310(99)00150-8. Stone, E. A., G. C. Lough, J. J. Schauer, P. S. Praveen, C. E. Corrigan, and V. Ramanathan (2007), Understanding the origin of black carbon in the atmospheric brown cloud over the Indian Ocean, J. Geophys. Res.-Atmos., 112, D22S23, doi: 10.1029/2006JD008118. Wu, S. P., S. Tao, Z. H. Zhang, T. Lan, and Q. Zuo (2005), Distribution of particle-phase hydrocarbons, PAHs and OCPs in Tianjin, China, Atmos. Environ., 39(38), 7420-7432, .doi: org/10.1016/j.atmosenv.2005.08.031. Xu, Y., Y. L. Zhang, J. Li, R. Gioia, G. Zhang, X.-D. Li, B. Spiro, R. S. Bhatia, and K. C. Jones (2012), The spatial distribution and potential sources of polycyclic aromatic hydrocarbons (PAHs) over the Asian marginal seas and the Indian and Atlantic Oceans, J. Geophys. Res.-Atmos., 117, D07302, doi: 10.1029/2011JD016585. Zhang, H. Dou, B. Chang, Z. Wei, W. Qiu, S. Liu, W. Liu, and S. Tao (2008), Emission of Polycyclic Aromatic Hydrocarbons from Indoor Straw Burning and Emission Inventory Updating in China, Ann. N.Y. Acad. Sci., 1140(1), 218-227, doi: 10.1196/annals.1454.006.
