Supporting Information - Springer Static Content Server
advertisement
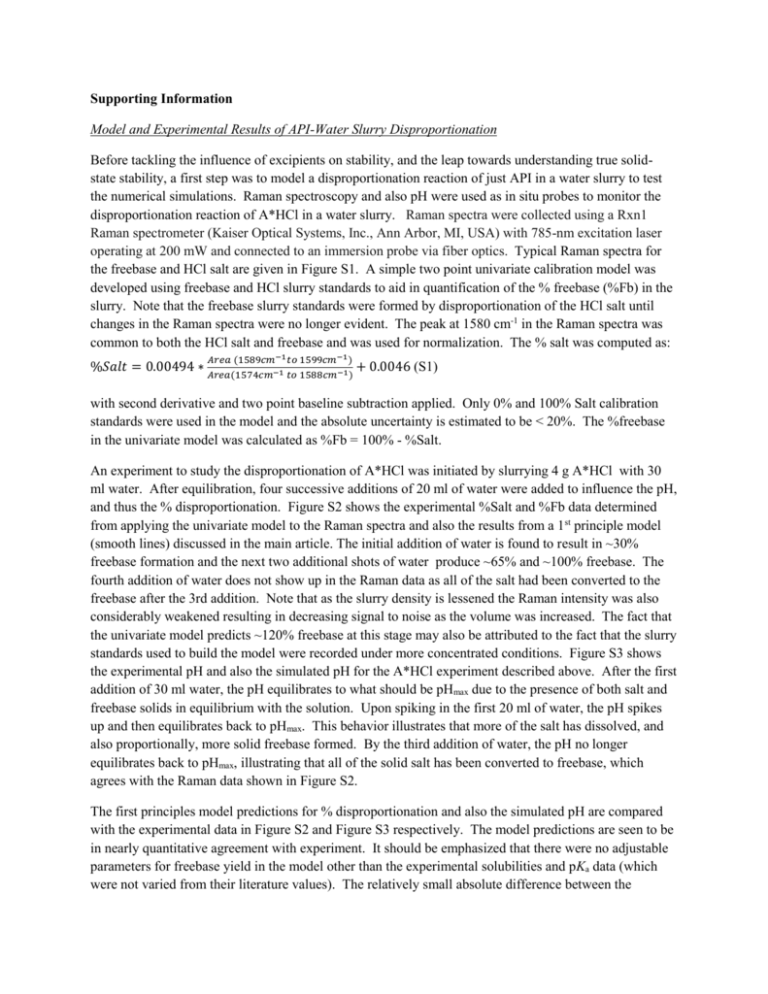
Supporting Information Model and Experimental Results of API-Water Slurry Disproportionation Before tackling the influence of excipients on stability, and the leap towards understanding true solidstate stability, a first step was to model a disproportionation reaction of just API in a water slurry to test the numerical simulations. Raman spectroscopy and also pH were used as in situ probes to monitor the disproportionation reaction of A*HCl in a water slurry. Raman spectra were collected using a Rxn1 Raman spectrometer (Kaiser Optical Systems, Inc., Ann Arbor, MI, USA) with 785-nm excitation laser operating at 200 mW and connected to an immersion probe via fiber optics. Typical Raman spectra for the freebase and HCl salt are given in Figure S1. A simple two point univariate calibration model was developed using freebase and HCl slurry standards to aid in quantification of the % freebase (%Fb) in the slurry. Note that the freebase slurry standards were formed by disproportionation of the HCl salt until changes in the Raman spectra were no longer evident. The peak at 1580 cm-1 in the Raman spectra was common to both the HCl salt and freebase and was used for normalization. The % salt was computed as: 𝐴𝑟𝑒𝑎 (1589𝑐𝑚−1 𝑡𝑜 1599𝑐𝑚−1 ) %𝑆𝑎𝑙𝑡 = 0.00494 ∗ 𝐴𝑟𝑒𝑎(1574𝑐𝑚−1 𝑡𝑜 1588𝑐𝑚−1 ) + 0.0046 (S1) with second derivative and two point baseline subtraction applied. Only 0% and 100% Salt calibration standards were used in the model and the absolute uncertainty is estimated to be < 20%. The %freebase in the univariate model was calculated as %Fb = 100% - %Salt. An experiment to study the disproportionation of A*HCl was initiated by slurrying 4 g A*HCl with 30 ml water. After equilibration, four successive additions of 20 ml of water were added to influence the pH, and thus the % disproportionation. Figure S2 shows the experimental %Salt and %Fb data determined from applying the univariate model to the Raman spectra and also the results from a 1st principle model (smooth lines) discussed in the main article. The initial addition of water is found to result in ~30% freebase formation and the next two additional shots of water produce ~65% and ~100% freebase. The fourth addition of water does not show up in the Raman data as all of the salt had been converted to the freebase after the 3rd addition. Note that as the slurry density is lessened the Raman intensity was also considerably weakened resulting in decreasing signal to noise as the volume was increased. The fact that the univariate model predicts ~120% freebase at this stage may also be attributed to the fact that the slurry standards used to build the model were recorded under more concentrated conditions. Figure S3 shows the experimental pH and also the simulated pH for the A*HCl experiment described above. After the first addition of 30 ml water, the pH equilibrates to what should be pHmax due to the presence of both salt and freebase solids in equilibrium with the solution. Upon spiking in the first 20 ml of water, the pH spikes up and then equilibrates back to pHmax. This behavior illustrates that more of the salt has dissolved, and also proportionally, more solid freebase formed. By the third addition of water, the pH no longer equilibrates back to pHmax, illustrating that all of the solid salt has been converted to freebase, which agrees with the Raman data shown in Figure S2. The first principles model predictions for % disproportionation and also the simulated pH are compared with the experimental data in Figure S2 and Figure S3 respectively. The model predictions are seen to be in nearly quantitative agreement with experiment. It should be emphasized that there were no adjustable parameters for freebase yield in the model other than the experimental solubilities and pKa data (which were not varied from their literature values). The relatively small absolute difference between the experimental and simulated pH and Raman trends given in the figures could be explained by a small calibration error of the pH meter or small changes in the solubility and pKa data used in the simulation. Effect of Activity coefficients on the model predictions The solubilities of the salts in the current work are reasonably high and thus the saturated solutions would not necessarily be considered dilute (ideal) and thus there could be an impact of the ionic strength of the solution on the activity coefficients. To test this hypothesis activity coefficients were estimated for the mono-salts using the empirical Davies approximation (Davies, C.W. (1962). Ion Association. London: Butterworths. pp. 37–53) to the Debye-Hückel theory given by: √𝐼 √ log 𝛾 = −0.51 (1+ 𝐼 − 0.2𝐼) (S2) I is the ionic strength of the solution (mol/L). For a water slurry experiment the ionic strength was taken as two times the observed salt solubility. The pKa of API base and salt forming acid were corrected for the activity coefficients according to: H Fb pK a (base) pK log FbH (S3) 0 a and H Cl pK a (acid ) pK log HCl 0 a (S4) The salt solubility product (Ksp) can be written as: K sp [ FbH ][Cl ] * FbH Cl (S5) Thus K sp FbH Cl was actually measured in the solubility experiments at ionic strength of two times the solubility. Using equation S2 for calculating the activity coefficient, the Ksp could be calculated independently such that the solubility could be predicted at any given ionic strength. For neutral species in electrolyte solutions the activity coefficient is often assumed to depend linearly on ionic strength as defined by the Setschenow equation: log 𝛾 = 𝐾𝑚 ∗ 𝐼 (S6) where Km is a Setschenow or “salting out” coefficient. The coefficients depend on the type of electrolyte present and in an experimental study on caffeine, theophylline, and theobromine, Km was determined to be in the range of -0.4 to 0.4 (P. Perez-Tejeda et al., J. Chem. Soc. Faraday Trans. 1, 1987, 83, 10291039). Because the nature of the electrolyte in modeling the formulation was not clear, nor the applicability to the API presented here, simulations were simply performed for Km = -0.1 and 0.1 to see the effects. The Setschenow equation was applied in the calculation of the activity coefficients of freebase (γFb) and salt forming acid (γHCl). In the experiment to determine the freebase solubility, γ was assumed to be 1, however in the modeling of the formulation the solubility was corrected based on equation S6. In the microhydration environment of the tablet, the ionic strength is not a well defined quantity. According to the approximation of solution mediated disproportionation employed in the model, we assume I cannot be less than that due to the dissolved API salt. Several of the excipients used in the prototypical formulations are electrolytes however and may influence I. As magnesium stearate and sodium croscarmellose are known to have low aqueous solubilities, their contribution was neglected. Sodium lauryl sulfate is highly water soluble and given the water volumes for formulation 1 at 75% RH could contribute to ~1 mol/L of ions to the ionic strength. Thus simulations were performed for ionic strengths of 1 mol/L. With the corrected values of pKa and solubility, the model simulations were performed as described in the article. The simulation results illustrated a very small difference in the predictions of % disproportionation (less than 2% difference for intermediate levels of disproportionation for B*HCl in F2, which is a salt with one of the highest solubilities, when comparing the γ=1 assumption and the case where the ionic strength only comes from the salt. This difference was also observed to correlate with the salt solubility as expected, thus predictions for salts with lower solubility were influenced even less. The simulation results comparing the formulation with 1 mol/L ionic strength did show a larger difference in the predictions. For B*HCl in F2 approximately +/- 10% change in the %disproportionation was predicted. Given the uncertainties in the treatment of the activities the error introduced could be larger however in this case all of the molecules are expected to exhibit a similar error, resulting in an absolute shift in the % disproportionation predictions, but preserving a relative comparison. Supporting Information Figures 2.5 Intensity (arb. units) 2 A 1.5 1 B 0.5 0 100 300 500 700 900 1100 wavenumber (cm-1) 1300 Figure S1. Typical Raman spectra for A*HCl (B) and freebase (A). 1500 1700 120 100 80 Model (% Salt) Model (% Fb) Exp. (% Salt) Exp. (% Fb) % 60 40 20 0 -20 0 10 20 30 40 50 60 70 80 Time (min) Figure S2. Experimental and model simulations of the %A*HCl and %freebase. The steps in the profiles are due to successive additions of water which result in disproportionation. 1.4 1.3 Model Experiment pH 1.2 1.1 1 0.9 0.8 0 10 20 30 40 Time (min) 50 60 70 80 Figure S3. Experimental and model simulations of the pH data for a A*HCl water slurry experiment. The steps in the profiles are due to successive additions of water which result in some disproportionation.


