file
advertisement
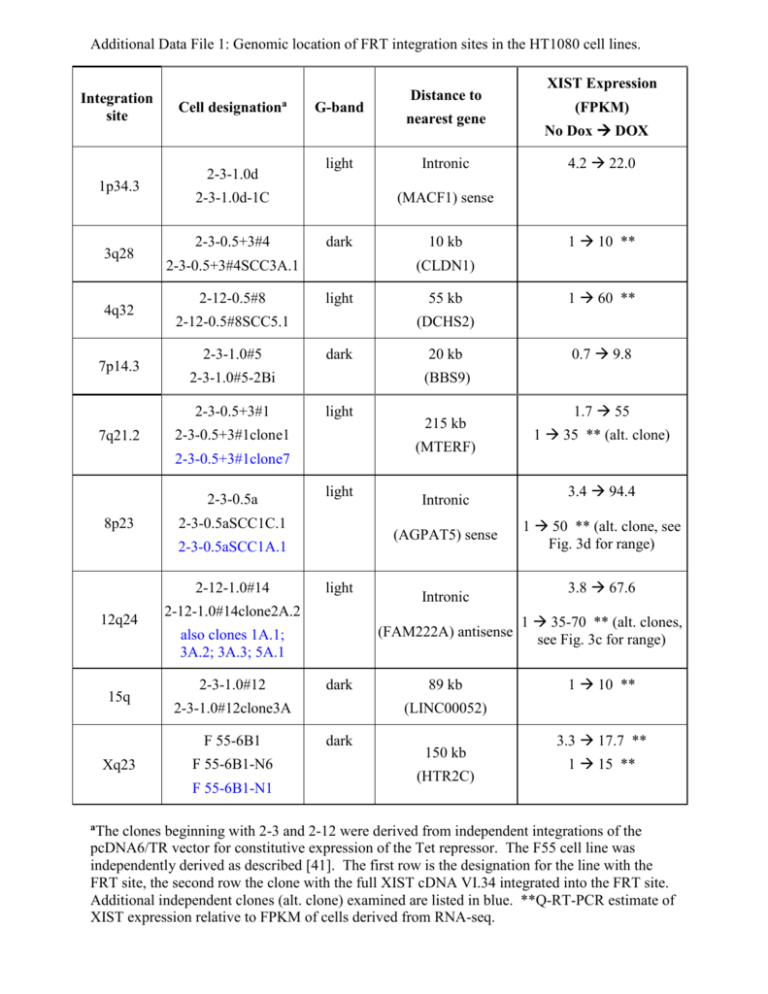
Additional Data File 1: Genomic location of FRT integration sites in the HT1080 cell lines. Integration site 1p34.3 3q28 4q32 7p14.3 Cell designationa 2-3-1.0d light 2-3-1.0d-1C 2-3-0.5+3#4 2-12-0.5#8 dark light dark light 2-3-0.5+3#1clone1 light light 2-3-1.0#12 F 55-6B1-N6 F 55-6B1-N1 aThe dark 2-3-1.0#12clone3A F 55-6B1 Xq23 20 kb 215 kb Intronic Intronic 2-12-1.0#14clone2A.2 also clones 1A.1; 3A.2; 3A.3; 5A.1 15q 55 kb (AGPAT5) sense 2-3-0.5aSCC1A.1 12q24 10 kb (MTERF) 2-3-0.5aSCC1C.1 2-12-1.0#14 4.2 22.0 1 10 ** 1 60 ** 0.7 9.8 (BBS9) 2-3-0.5+3#1clone7 8p23 No Dox DOX (DCHS2) 2-3-1.0#5-2Bi 2-3-0.5a Intronic (FPKM) (CLDN1) 2-12-0.5#8SCC5.1 2-3-1.0#5 nearest gene XIST Expression (MACF1) sense 2-3-0.5+3#4SCC3A.1 2-3-0.5+3#1 7q21.2 G-band Distance to 1.7 55 1 35 ** (alt. clone) 3.4 94.4 1 50 ** (alt. clone, see Fig. 3d for range) 3.8 67.6 (FAM222A) antisense 1 35-70 ** (alt. clones, see Fig. 3c for range) 89 kb 1 10 ** (LINC00052) dark 150 kb (HTR2C) 3.3 17.7 ** 1 15 ** clones beginning with 2-3 and 2-12 were derived from independent integrations of the pcDNA6/TR vector for constitutive expression of the Tet repressor. The F55 cell line was independently derived as described [41]. The first row is the designation for the line with the FRT site, the second row the clone with the full XIST cDNA VI.34 integrated into the FRT site. Additional independent clones (alt. clone) examined are listed in blue. **Q-RT-PCR estimate of XIST expression relative to FPKM of cells derived from RNA-seq.
