Density of Metals Lab
advertisement
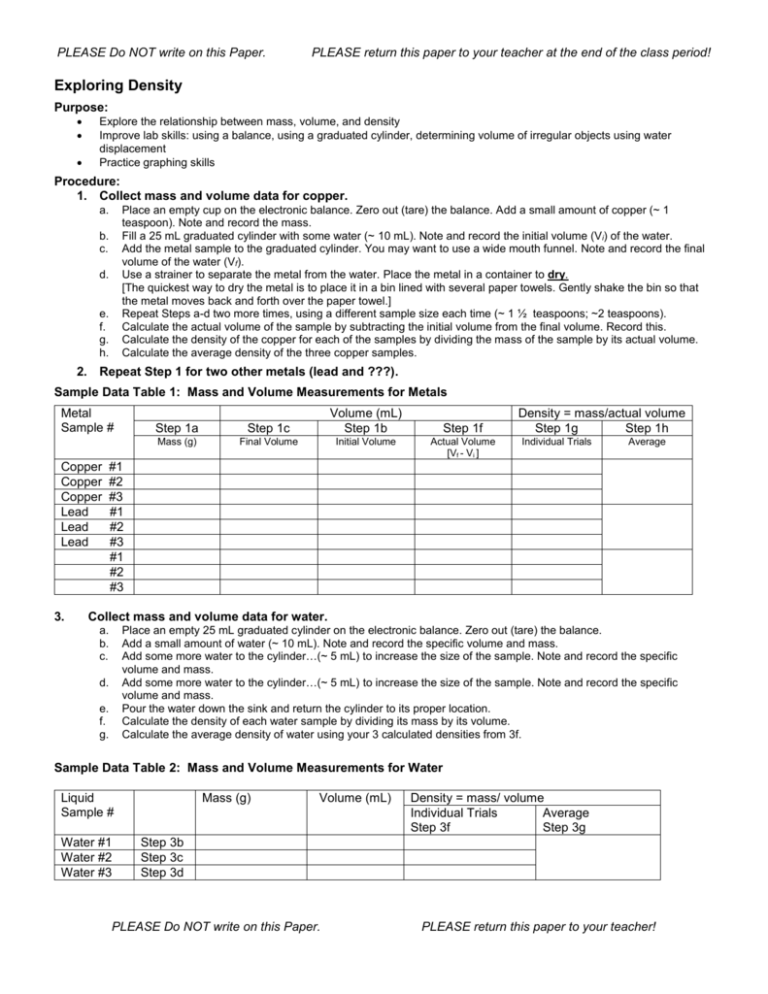
PLEASE Do NOT write on this Paper. PLEASE return this paper to your teacher at the end of the class period! Exploring Density Purpose: Explore the relationship between mass, volume, and density Improve lab skills: using a balance, using a graduated cylinder, determining volume of irregular objects using water displacement Practice graphing skills Procedure: 1. Collect mass and volume data for copper. a. Place an empty cup on the electronic balance. Zero out (tare) the balance. Add a small amount of copper (~ 1 teaspoon). Note and record the mass. Fill a 25 mL graduated cylinder with some water (~ 10 mL). Note and record the initial volume (Vi) of the water. Add the metal sample to the graduated cylinder. You may want to use a wide mouth funnel. Note and record the final volume of the water (Vf). Use a strainer to separate the metal from the water. Place the metal in a container to dry. [The quickest way to dry the metal is to place it in a bin lined with several paper towels. Gently shake the bin so that the metal moves back and forth over the paper towel.] Repeat Steps a-d two more times, using a different sample size each time (~ 1 ½ teaspoons; ~2 teaspoons). Calculate the actual volume of the sample by subtracting the initial volume from the final volume. Record this. Calculate the density of the copper for each of the samples by dividing the mass of the sample by its actual volume. Calculate the average density of the three copper samples. b. c. d. e. f. g. h. 2. Repeat Step 1 for two other metals (lead and ???). Sample Data Table 1: Mass and Volume Measurements for Metals Metal Sample # Copper Copper Copper Lead Lead Lead 3. Step 1a Step 1c Volume (mL) Step 1b Mass (g) Final Volume Initial Volume Step 1f Actual Volume [Vf - Vi ] Density = mass/actual volume Step 1g Step 1h Individual Trials Average #1 #2 #3 #1 #2 #3 #1 #2 #3 Collect mass and volume data for water. a. b. c. Place an empty 25 mL graduated cylinder on the electronic balance. Zero out (tare) the balance. Add a small amount of water (~ 10 mL). Note and record the specific volume and mass. Add some more water to the cylinder…(~ 5 mL) to increase the size of the sample. Note and record the specific volume and mass. Add some more water to the cylinder…(~ 5 mL) to increase the size of the sample. Note and record the specific volume and mass. Pour the water down the sink and return the cylinder to its proper location. Calculate the density of each water sample by dividing its mass by its volume. Calculate the average density of water using your 3 calculated densities from 3f. d. e. f. g. Sample Data Table 2: Mass and Volume Measurements for Water Liquid Sample # Water #1 Water #2 Water #3 Mass (g) Volume (mL) Density = mass/ volume Individual Trials Average Step 3f Step 3g Step 3b Step 3c Step 3d PLEASE Do NOT write on this Paper. PLEASE return this paper to your teacher! PLEASE Do NOT write on this Paper. PLEASE return this paper to your teacher at the end of the class period! Data Analysis – Part I – Graph – Do this on Graph Paper* !!! (*Your teacher may opt to require computer-generated graphs.) 1. Construct a graph of Mass (y-axis) versus Volume (x-axis). Be sure to have a title and label the axes (with units). Find your greatest Mass value and use that to set up your increments for the y-axis. Be sure to start with 0. Find your greatest Volume value and use that to set up your increments for the x-axis. Be sure to start with 0. 2. Plot the three data points for copper in one color/shape. Use a ruler to draw a ‘best fit’ line that passes through 0,0. 3. Plot the three data points for Metal #2 in a different color/shape. Use a ruler to draw a ‘best fit’ line that passes through 0,0. 4. Plot the three data points for Metal #3 in a different color/shape. Use a ruler to draw a ‘best fit’ line that passes through 0,0. 5. Plot the three data points for water in a different color/shape. Use a ruler to draw a ‘best fit’ line that passes through 0,0. 6. Make a legend for the 4 different substances that shows which color/shape goes with which substance. Data Analysis – Part II – Questions – Answer these in your Chemistry comp book. Answer using complete sentences or properly labeled math equations. 1. What does your graph show you? 2. Define the term ‘precision’. 3. Look at your lab data. For which substance is the data the most precise? Explain. 4. Define the term ‘accuracy’. 5. Record the ‘published’ densities of the three metals and water. (Your teacher may provide these or will refer you to a resource.) 6. What is the formula for determining percent error? 7. Calculate the percent error for the density of each metal and water. Show your work. Circle your answers. 8. Which substance had the highest percent error in its measured density? Explain one reason why you think this value was not very accurate. 9. What does the slope of each line on your graph represent? 10a. Using the graph, calculate the density of the substance with the steepest slope. Show your work ! Circle your answer. [Remember Slope = rise/run or y/x Pick 2 points on your graph that are ‘conveniently placed’. Use these to determine slope. Or if you have the equation of the line of best fit (y=mx + b), you can simply record the slope of the line (m).] 10b. Is this value more or less accurate than the average value for the density you calculated in Step 1g? Explain. Conclusion Write a short summary paragraph of what your graph shows you using the terms…. density, slope, sink, float, water, copper, lead, _______ (the other metal your group tested). PLEASE Do NOT write on this Paper. PLEASE return this paper to your teacher!
