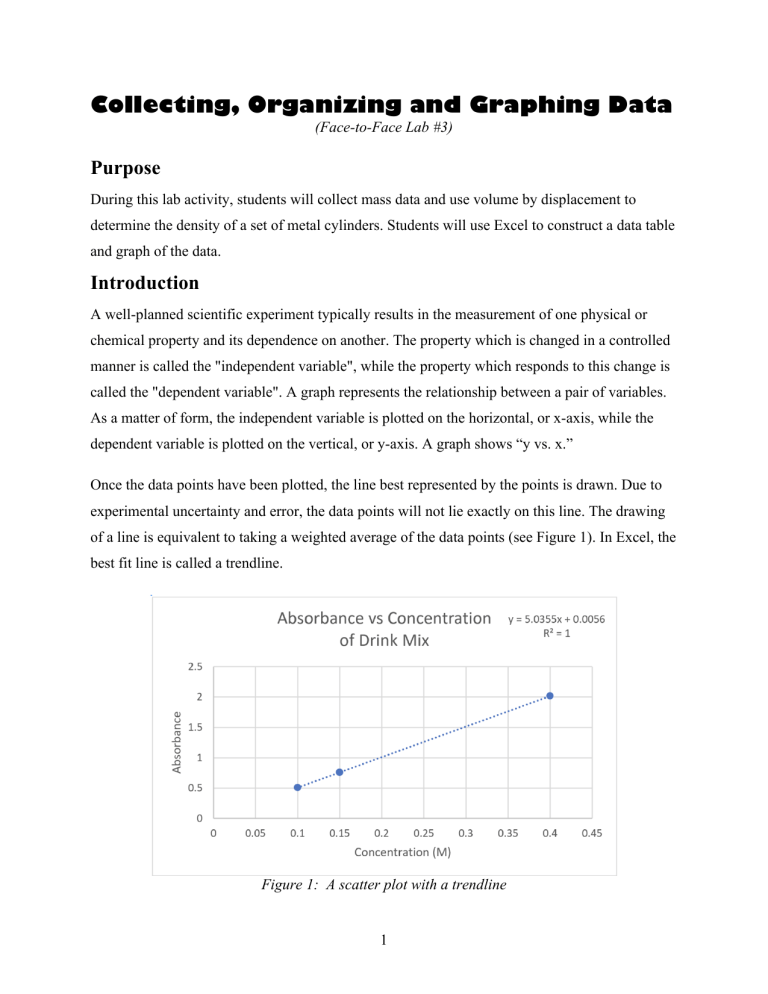
Collecting, Organizing and Graphing Data (Face-to-Face Lab #3) Purpose During this lab activity, students will collect mass data and use volume by displacement to determine the density of a set of metal cylinders. Students will use Excel to construct a data table and graph of the data. Introduction A well-planned scientific experiment typically results in the measurement of one physical or chemical property and its dependence on another. The property which is changed in a controlled manner is called the "independent variable", while the property which responds to this change is called the "dependent variable". A graph represents the relationship between a pair of variables. As a matter of form, the independent variable is plotted on the horizontal, or x-axis, while the dependent variable is plotted on the vertical, or y-axis. A graph shows “y vs. x.” Once the data points have been plotted, the line best represented by the points is drawn. Due to experimental uncertainty and error, the data points will not lie exactly on this line. The drawing of a line is equivalent to taking a weighted average of the data points (see Figure 1). In Excel, the best fit line is called a trendline. Figure 1: A scatter plot with a trendline 1 Once the graph has been made, it is often useful to determine an equation in order to represent the information in the most concise way possible. The discussion herein deals only with straightline relationships. In addition to expressing the relationship between variables, the slope and yintercept of a straight line can often be related to physical values. The general form for the equation of a straight line relating the variables x and y is y = mx + b where b is the y-intercept. Note that y equals b when x = 0. The slope of the line is given by m. The slope can have any value: positive, negative or zero. A positive slope means that y increases as x increases, while a negative slope means that y decreases as x increases. A slope of zero would indicate that the value of y is constant, and independent of the value of x. The line in Figure 1 illustrates a positive slope. The magnitude of the slope tells how rapidly y changes as x changes. A large slope indicates a rapid change with respect to the x parameter, while a small slope indicates a slow change. The slope of the line is calculated by comparing the rate of change in y to the rate of change in x: slope = m = Δy y 2 − y1 = Δx x2 − x1 where the symbol Δ indicates "change in" the value that follows it. The slope is evaluated from the best straight line and the points used to determine Δy and Δx are taken from the line, and not from the experimental values. Density measures the ratio of mass to volume for a particular substance. Density is a measure of how closely packed particles of a substance are. Density is given by the equation: # != $ Density is not unique to a substance: two different substances may have the same density. However, if both temperature and pressure are held constant, the same substance will have the same density. 2 Figure 2: The method of volume by displacement Determining the volume of solids is often accomplished through the method of volume by displacement (Figure 2.). If a material is submerged in a liquid, it will displace a volume of liquid equal to the volume of the object. This process was first expressed by a Greek mathematician and scientist, Archimedes. During this lab you will evaluate the density of a metal by creating an Excel plot. 3 Questions Work by yourself or with another student to answer the following questions. 1. Is density a physical or chemical property? Explain. Density is a physical property, it measures how tightly things are packed and can be deterined by mass and volume 2. A 10.0 mL sample of an unknown liquid has a mass of 7.979 g. Using the table provided, what is the likely identity of the liquid? Show the set-up for your calculation. The identity of the substance is ethanol, I divided the 10.0 ml (volume) by 7.979 (mass) and got 0.789. Substance Density at 25oC in g/mL Ethylene glycol 1.09 Sea Water 1.02 Water 1.00 Ethanol 0.789 3. What method will you use to determine the volume of your irregular solid? Water displacement, you have the water at a set amount and add the object, then subtract the original amount of water. 4 Scientists rely on data to describe nature and uncover relationships. The raw data – measurements taken in the lab – are most useful when they are organized in a way that makes the relationships clear. Graphing often provides a clear illustration of the relationships, and allows us to extrapolate results to points not actually measured. Consider this data collected by a lab class: Group Number Volume (cm3) Mass (g) Substance 1 2.0 17.92 Copper 2 6.0 50.89 Copper 3 10.0 93.45 Copper 4 8.0 79.30 Copper 5 14.0 125.44 Copper 6 4.0 39.80 Copper 7 12.0 103.85 Copper Note that each column header has a label (group number, volume, mass, etc.) and units when needed (cm3 and g.) 4. Which do you think was the independent variable in the experiment? Why? The volume is the factor that the experimenter intentionally changes or controls. The lab class is likely varying the volume of the substance they are working with Which was the dependent variable? Why? The mass is the dependent variable because it depends on how much stuff they're using. 5 5. The data seems to have been organized by group number. Is this helpful in seeing the relationship between volume and mass? Explain. ! ! The data could be orginized better, it helps but not as much. ! ! ! ! 6. Organize the data in a better way; use the table below. 17.92 copper 1 2.0 2 6.0 50.89 copper 3 10.0 93.45 copper 4 8.0 79.30 copper 5 14.0 125.44 copper 6 4.0 39.80 copper 7 12.0 103.85 copper When scientists design an experiment they are usually looking for a cause-and-effect relationship between the independent and dependent variables. Therefore, organizing the data by the independent variable is the easiest way to reveal a relationship. When the data is not organized, the relationship may not be apparent. 6 Consider several possible graphs of the data: 7. Identify each of the graphs as a bar graph or a scatter plot. A: Scatter B: Bar C: scatter 8. One of the points in graph B indicates that a volume of 8 cm3 has a mass of 80 g. Which other graph shows this same data? Graph C 9. Of the graphs above, which illustrates the relationship between the variables most clearly? What is that relationship? Graph C shows the density relationship the most clearly 7 Part A: Collecting Mass and Volume Data 1.! Obtain four samples of the same unknown metal from the stockroom. Record the unknown number on your data sheet. 2.! Order the samples from shortest to longest. The shortest sample will be Sample 1 and the longest sample will be Sample 4. 3.! Measure and record the mass of each one of the samples on your data sheet. 4.! Pour enough water into a 10 mL graduated cylinder to cover the sample. The water should not exceed the 10 mL mark after the sample has been added. 5.! Measure and record the volume of water to the appropriate number of significant figures. 6.! Carefully place the sample into the water in the cylinder. Don’t break the graduated cylinder! Use caution when adding the metal samples to the graduated cylinder. Tip the cylinder and slowly slide the metal down at an angle into the water to avoid breaking the glass. 7.! Measure and record the volume of the water + the sample. 8.! Remove the sample from the cylinder and pour the water down the drain. Dry the sample. 9.! Calculate the volume of the sample as follows: Volume of sample = (Volume of H2O + sample) – (Volume of H2O) 10.! Repeat steps 4 through 9 for Trials 2 and 3. Using the same method, obtain the volumes of each of the other three samples. Why obtain three volumes for each metal sample? The volume data is prone to human error. If you are working with another student, it is recommended that each student independently determines the volume of each sample. A large discrepancy in the volume of the same metal sample indicates an error. 11.! Calculate the average volume for each one of the samples and record this value on your data sheet. 8 Part B: Graphing the Data 1.! Graphical representation of data is the most reliable and accurate way to determine the density of your unknown metal sample. You will be using Excel to graph the mass (on the y-axis) versus the average volume (on the x-axis). The data table only needs two columns: mass (g) and average volume (mL). 2.! You need to present your graph with a “best-fit” line showing both the equation for the line and the R2 value. 3.! Use the Excel graph to determine the density of the metal. Excel Checklist Did you? ! ! ! ! ! ! ! ! ! ! ! Create a data table and enter data Format cells to the appropriate number of significant figures Outline data table cells Wrap text in data table cells Create a scatter plot (graph) Add a trendline to the scatter plot Display an equation for the trendline Display the R-squared value for the trendline Adjust the significant figures on the equation for the trendline Label the x and y axis on the graph Title the graph 9 Data Sheet Describe the appearance of the metal. Mass of Unknown Metal Sample Number Mass (g) 1 2.23g 2 4.52g 3 5.57g 4 6.70g 10 Volume of Unknown Metal ! Volume (mL) Trial 1 Volume (mL) Trial 2 ! Volume (mL) Trial 3 Average Volume (mL) Sample 1 H2O 6.0 6.0 6.0 H2O + Sample 1 6.8 6.85 6.85 Sample 1 0.8 0.85 0.85 0.83 Sample 2 H2O 6.0 0.83 6.0 H2O + Sample 2 7.75 7.75 7.75 Sample 2 1.75 1.75 1.75 1.75 Sample 3 H2O 6.0 6.0 6.0 H2O + Sample 3 8.1 8.15 8.15 Sample 3 2.1 2.15 2.15 2.13 Sample 4 H2O H2O + Sample 4 Sample 4 ! 8.55 ! 2.55 ! 6.0 ! 8.5! 2.5! 6.0 11 ! 8.5 ! 2.5 ! 6.0 ! 2.52 Post-Lab Questions 1. What is the calculated density of your unknown metal? Report your answer to the correct number of significant figures and with the correct units. (This value is determined from the slope of your line.) **Submit a copy of your Excel data sheet and plot to your instructor. 2. Are all four screws made from the same metal? What evidence do you have to support your conclusion? Yes the only difference was the mass of each, the correlation between each were clear. . 3. If air bubbles were trapped underneath the solid after it was placed in the graduated cylinder, would the measured volume be artificially high, artificially low, or unaffected? What would be the effect of this error on the calculated density? artificially high, the object would be too high in the water causing to be un accruate. 4. Densities are given in tables with a temperature at which the measurements were made. How would an increase in the temperature of a metal sample change the value of its density? (Hint: In general, materials expand as they are heated as the atoms or molecules start to move farther apart.) The higher the temprature the lower the density. 12
