The experimental observation and modelling of film thinning and film
advertisement
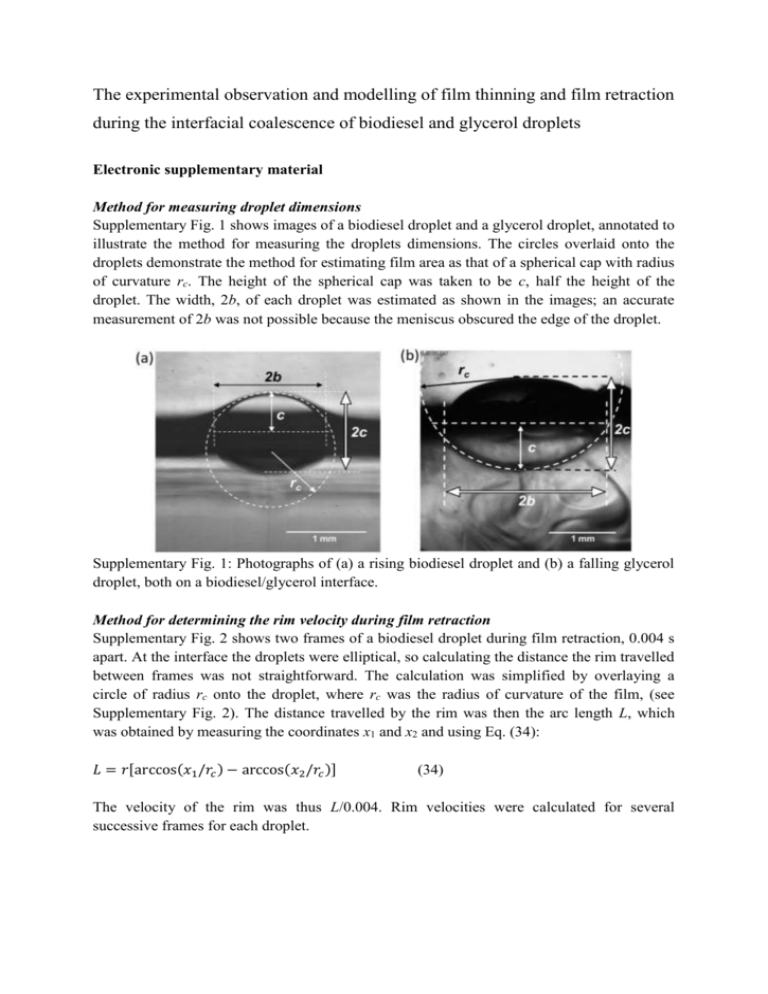
The experimental observation and modelling of film thinning and film retraction during the interfacial coalescence of biodiesel and glycerol droplets Electronic supplementary material Method for measuring droplet dimensions Supplementary Fig. 1 shows images of a biodiesel droplet and a glycerol droplet, annotated to illustrate the method for measuring the droplets dimensions. The circles overlaid onto the droplets demonstrate the method for estimating film area as that of a spherical cap with radius of curvature rc. The height of the spherical cap was taken to be c, half the height of the droplet. The width, 2b, of each droplet was estimated as shown in the images; an accurate measurement of 2b was not possible because the meniscus obscured the edge of the droplet. Supplementary Fig. 1: Photographs of (a) a rising biodiesel droplet and (b) a falling glycerol droplet, both on a biodiesel/glycerol interface. Method for determining the rim velocity during film retraction Supplementary Fig. 2 shows two frames of a biodiesel droplet during film retraction, 0.004 s apart. At the interface the droplets were elliptical, so calculating the distance the rim travelled between frames was not straightforward. The calculation was simplified by overlaying a circle of radius rc onto the droplet, where rc was the radius of curvature of the film, (see Supplementary Fig. 2). The distance travelled by the rim was then the arc length L, which was obtained by measuring the coordinates x1 and x2 and using Eq. (34): 𝐿 = 𝑟[arccos(𝑥1 /𝑟𝑐 ) − arccos(𝑥2 /𝑟𝑐 )] (34) The velocity of the rim was thus L/0.004. Rim velocities were calculated for several successive frames for each droplet. Supplementary Fig. 2: Images of a biodiesel droplet at a biodiesel/glycerol interface after the rupture of the film. The rim of the film can be seen as a dark ring. The time interval between (a) and (b) was 0.004 s, when the rim travelled distance L. This approach was suitable for biodiesel droplets, which tended to rupture near the top. However, glycerol droplets often ruptured on the side, (see Supplementary Fig. 3). The rim velocity was then determined from the distance travelled in the x direction. A plan view of the droplet in the plane of z = 0, which intersects the expanding hole, is shown in Supplementary Fig. 4. It is assumed that the rim followed a circular path as it retracted around the droplet. From Supplementary Fig. 4, it can be seen that the arc length L travelled by the rim between frames is given by: 𝐿 = 𝑟[arccos(𝑥2 /𝑟ℎ ) − arccos(𝑥1 /𝑟ℎ )] (35) where rh is the droplet radius in the plane of z = 0, as shown in Supplementary Fig. 4. The x positions of the rim were recorded for frames 0.04 s apart, so that the velocities were L/0.04. Supplementary Fig. 3: Images of a glycerol droplet at a biodiesel/glycerol interface after the rupture of the film. The rim of the film can be seen as a dark ring. Supplementary Fig. 4: View from above the glycerol droplet in Supplementary Fig. 3 at the plane of z = 0. Supplementary data Tables 1 to 6 provide experimental data used in the film thinning and film retraction analysis. Table 1: Viscosities and densities of biodiesel and glycerol Viscosity (mPa.s) Density (kg/m3) Biodiesel 6.5 880 Glycerol 53 1090 Table 2: Measured dimensions of biodiesel and glycerol droplets. The errors reflect the limits of the measurement accuracy, which was due to the definition of the photographs or obscuration by the meniscus. Standard deviations reflect the spread of the measurements. Biodiesel droplet Dimension Standard deviation Mean Number of droplets Glycerol droplet Standard deviation Mean 37 26 Droplet width, 2b (mm) 1.5 ± 0.1 0.15 2.4 ± 0.1 0.88 Droplet height, 2c (mm) 1.10 ± 0.06 0.08 1.42 ± 0.06 0.36 Radius of curvature, rc (mm) 0.92 ± 0.05 0.08 1.46 ± 0.07 0.60 Film area (mm2) Initial droplet radius, ri (mm) 3.2 ± 0.4 1.36 ± 0.05 6.5 ± 0.6 0.08 Not measured Table 3: Experimental data of rim velocities measured for four different types of droplet. Number of droplets analysed Number of velocity measurements Mean rim velocity (mm/s) Maximum velocity (mm/s) Minimum velocity (mm/s) Biodiesel droplet in crude glycerol 19 187 17 60 4 Crude glycerol droplet in biodiesel 12 116 4 7 3 PDMS droplet in aqueous glycerol 5 21 387 620 78 Aqueous glycerol droplet in PDMS 5 14 255 329 208 Droplet type Table 4: Dimensions of droplets in rim velocity study. Droplet type Number of droplets analysed Droplet width (mm) Droplet height (mm) Mean Standard deviation Mean Standard deviation Biodiesel droplet in crude glycerol 19 1.4 ± 0.1 0.1 1.12 ± 0.05 0.07 Crude glycerol droplet in biodiesel 12 3.5 ± 0.1 0.5 1.95 ± 0.05 0.20 PDMS droplet in aqueous glycerol 5 5.0 ± 0.1 0.03 4.09 ± 0.05 0.04 Aqueous glycerol droplet in PDMS 5 3.5 ± 0.1 0.2 3.10 ± 0.05 0.18 Table 5: Parameters used to solve Eq. (14) and Eq. (18) for rim velocity. The rim radius, a, could not be measured but an assumed value of 10 μm was used in Eq. (14). σ (mN/m) μf (mPa.s) μc (mPa.s) ρc (kg/m3) a (μm) Re Biodiesel droplet in crude glycerol 0.6a 53 6.5 880 10.0 0.0035 Crude glycerol droplet in biodiesel 0.6a 6.5 53 1090 10.0 0.0054 PDMS droplet in aqueous glycerol 28.7a 60b 4.8c 963 10.0 0.0078 10.0 0.5084 Droplet type Aqueous glycerol 28.7a 4.8c 60b 1208 droplet in PDMS a Measured by the du Noüy ring method using a Krüss K12 Processor Tensiometer. b Obtained from Viscosity of aqueous glycerol solutions, Dow Chemical Company. c Measured by strain rate sweep using an ARES viscometer with Couette cell. Table 6: Results of experimental measurements compared with predictions from Eq. (14) and Eq. (18) for the rim velocities of four types of droplet. Droplet type Measured rim velocity (mm/s) Solution to Eq. (14) (mm/s) Solution to Eq. (18) (mm/s) Mean Standard deviation Biodiesel droplet in crude glycerol 17 10 58 11 Crude glycerol droplet in biodiesel 4 0.8 13 92 PDMS droplet in aqueous glycerol 387 138 862 517 Aqueous glycerol droplet in PDMS 255 32 336 6458
