Chem120_Cu_AA_datasheet
advertisement
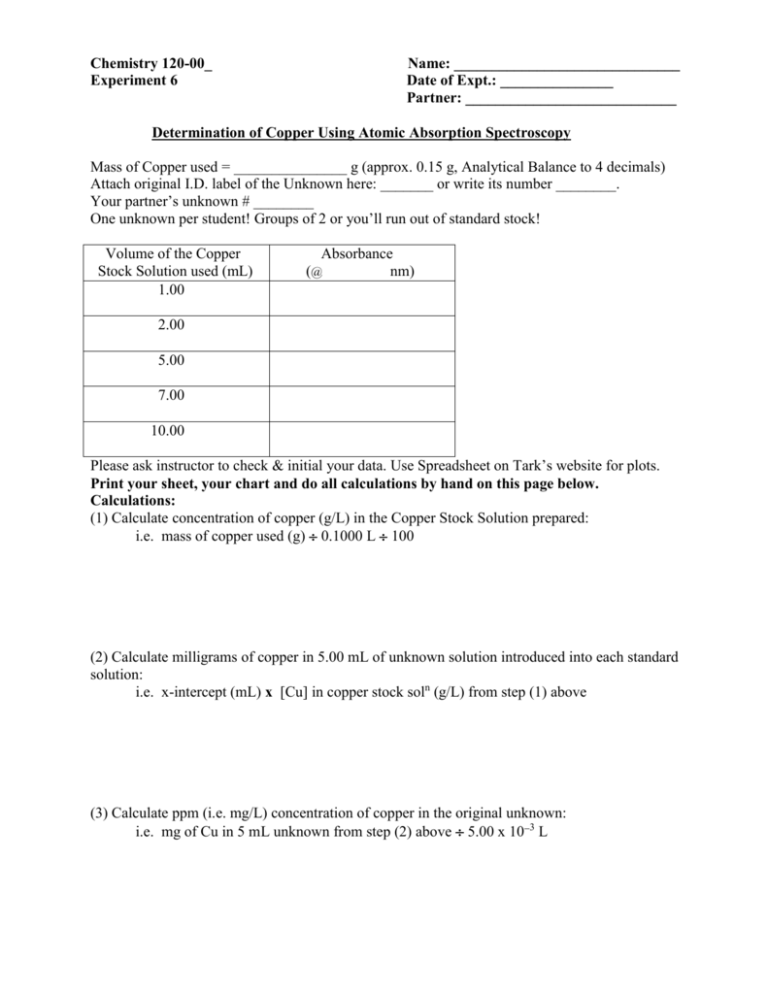
Chemistry 120-00_ Experiment 6 Name: ______________________________ Date of Expt.: _______________ Partner: ____________________________ Determination of Copper Using Atomic Absorption Spectroscopy Mass of Copper used = _______________ g (approx. 0.15 g, Analytical Balance to 4 decimals) Attach original I.D. label of the Unknown here: _______ or write its number ________. Your partner’s unknown # ________ One unknown per student! Groups of 2 or you’ll run out of standard stock! Volume of the Copper Stock Solution used (mL) 1.00 Absorbance (@ nm) 2.00 5.00 7.00 10.00 Please ask instructor to check & initial your data. Use Spreadsheet on Tark’s website for plots. Print your sheet, your chart and do all calculations by hand on this page below. Calculations: (1) Calculate concentration of copper (g/L) in the Copper Stock Solution prepared: i.e. mass of copper used (g) 0.1000 L 100 (2) Calculate milligrams of copper in 5.00 mL of unknown solution introduced into each standard solution: i.e. x-intercept (mL) x [Cu] in copper stock soln (g/L) from step (1) above (3) Calculate ppm (i.e. mg/L) concentration of copper in the original unknown: i.e. mg of Cu in 5 mL unknown from step (2) above 5.00 x 10³ L For your write up your report on Word should have the following items: 1. Title: Determination of the concentration of an unknown copper solution in ppm by Atomic Absorbtion Spectroscopy and the method of Standard Additions. 2. AA Theory: Explain how and why Atomic Absorbtion Spectroscopy is element specific, describe its sensitivities in terms of concentrations it can detect and draw and label the parts of an AA Spectrophotometer. 3. Explain the Method of Standard Additions, how it differs from ordinary methods with separate standards and unknowns and give the reason for its advantage over those other methods. How is your unknown concentration expressed or resolved? 4. Data sheet must be signed and stapled to the lab report. 5. Print your spreadsheet showing your standard volumes used and their absorbance values along with the concentration of your unknown in standard volume equivalents. 6. Update and annotate your chart to show your data, your best fit linear regression line, the equation of the line and ensure that the negative X-axis intercept is shown. Print your chart. 7. Conclusion: My unknown # _______ had a concentration of ______ ppm Cu.
