Ch. 3 Review Which of the following residual plots indicates a
advertisement
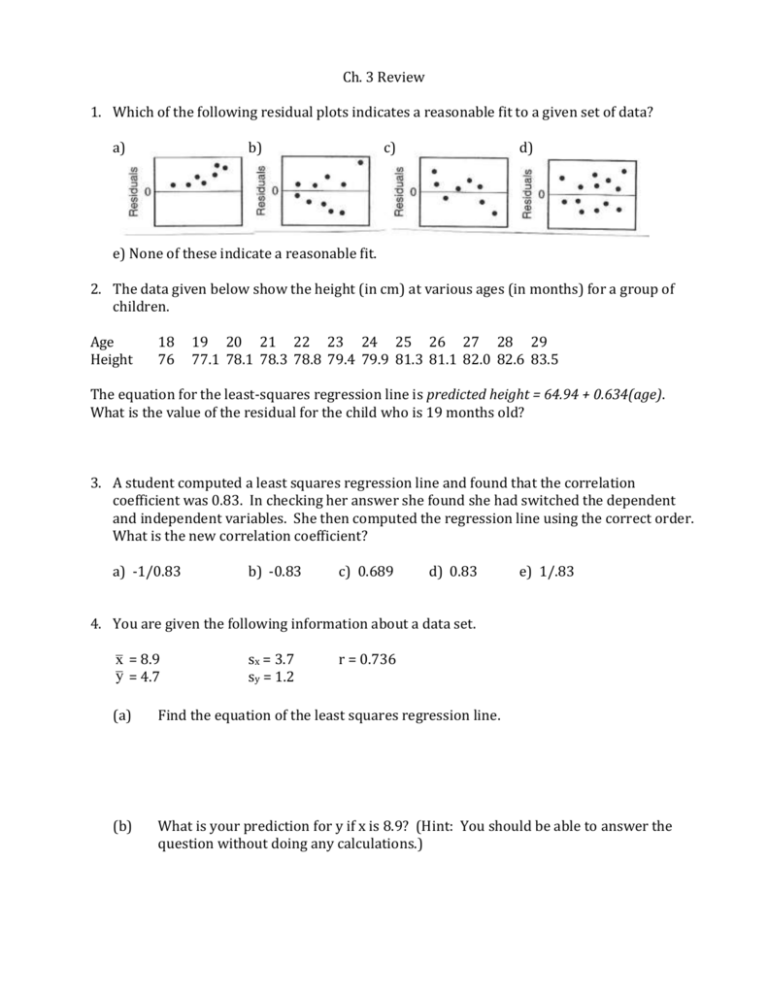
Ch. 3 Review 1. Which of the following residual plots indicates a reasonable fit to a given set of data? a) b) c) d) e) None of these indicate a reasonable fit. 2. The data given below show the height (in cm) at various ages (in months) for a group of children. Age Height 18 76 19 20 21 22 23 24 25 26 27 28 29 77.1 78.1 78.3 78.8 79.4 79.9 81.3 81.1 82.0 82.6 83.5 The equation for the least-squares regression line is predicted height = 64.94 + 0.634(age). What is the value of the residual for the child who is 19 months old? 3. A student computed a least squares regression line and found that the correlation coefficient was 0.83. In checking her answer she found she had switched the dependent and independent variables. She then computed the regression line using the correct order. What is the new correlation coefficient? a) -1/0.83 b) -0.83 c) 0.689 d) 0.83 e) 1/.83 4. You are given the following information about a data set. x = 8.9 y = 4.7 sx = 3.7 sy = 1.2 r = 0.736 (a) Find the equation of the least squares regression line. (b) What is your prediction for y if x is 8.9? (Hint: You should be able to answer the question without doing any calculations.) 5. 5. 6. 6. 7. A scatterplot of student height, in inches, versus corresponding arm span length, in inches, is shown below. One of the points in the graph is labeled A. a) b) c) d) e) If the point labeled A is removed, which of the following statements would be true? The slope of the least squares regression line is unchanged and the correlation coefficient increases. The slope of the least squares regression line is unchanged and the correlation coefficient decreases. The slope of the least squares regression line increases and the correlation coefficient increases. The slope of the least squares regression line increases and the correlation coefficient decreases. The slope of the least squares regression line decreases and the correlation coefficient increases. 8. The computer output below shows the result of a linear regression analysis for predicting the concentration of zinc, in parts per million (ppm), from the concentration of lead, in ppm, found in fish from a certain river. Which of the following statements is a correct interpretation of the value 19.0 in the output? a) On average there is a predicted increase of 19.0 ppm in concentration of lead for every increase of 1 ppm in concentration of zinc found in the fish. b) On average there is a predicted increase of 19.0 ppm in concentration of zinc for every increase of 1 ppm in concentration of lead found in the fish. c) The predicted concentration of zinc is 19.0 ppm in fish with no concentration of lead. d) The predicted concentration of lead is 19.0 ppm in fish with no concentration of zinc. e) Approximately 19% of the variability in zinc concentration is predicted by its linear relationship with lead concentration. 10. The weight, in pounds, of a full backpack and the corresponding number of books in the backpack were recorded for each of 10 college students. The resulting data were used to create the residual plot and the regression output shown below. Which of the following values is closest to the actual weight, in pounds, of the backpack for the student who had 4 books in the backpack? a) b) c) d) e) 8 10 13 15 17 11. The weights of children in the Egyptian village of Nahya were recorded. The scatterplot, residual plot, and computer output below shows the relationship between the mean weights and age of the 170 children in the village. a) Interpret the scatterplot of mean weight against time. b) What is the correlation between age and weight? c) Determine the equation of the LSRL for this data. Define any variables used in your equation. d) What is the value of r2? Interpret r2. e) Based on the residual plot, is the LSRL an appropriate model for the data set? Explain.

