TEP
5.4.5201
X-ray fluorescence spectroscopy –
layer thickness determination
Related topics
Bremsstrahlung, characteristic X-radiation, fluorescent yield, Auger effect, coherent and incoherent photon scattering, law of absorption, mass attenuation coefficient, saturation thickness, matrix effects, semiconductor energy detectors and multi-channel analysers.
Principle
X-ray fluorescence analysis (XRF) is suitable for the noncontact and non-destructive thickness measurement of thin layers as well as for determining their chemical composition. For this type of measurement, the X-ray source and detector are located on the same side of the sample. When the layer on the
substrate is subjected to X-rays, the radiation will penetrate the layer, if it is sufficiently thin, to a certain
extent, depending on the thickness, and in turn cause characteristic fluorescence radiation in the material of the underlying substrate. On its way to the detector, this fluorescence radiation will be attenuated by
absorption at the layer. The thickness of the layer can be determined based on the intensity attenuation
of the fluorescence radiation of the substrate material.
Equipment
1
1
1
1
1
1
1
1
1
XR 4.0 expert unit 35kV
XR 4.0 Goniometer for X-ray unit, 35 kV
XR 4.0 Plug-in module with W X-ray tube
Diaphragm tube d = 1 mm
Diaphragm tube d = 5 mm
Multi-channel analyser
X-ray energy detector
XR 4.0 XRED cable 50 cm
Screened cable, BNC, l = 750 mm
09057-99
09057-10
09057-80
09057-01
09057-03
13727-99
09058-30
09058-32
07542-11
Set of metal samples for the X-ray fluorescence analysis, set of 7
Set of samples for the quantitative X-ray
1
fluorescence analysis, set of 4
1 Universal crystal holder for the X-ray unit
1 Software for the multi-channel analyser
Household aluminium foil
PC, Windows® XP or higher
1
09058-31
09058-34
09058-02
14452-61
This experiment is included in the upgrade package: XRM 4.0 X-ray material analysis.
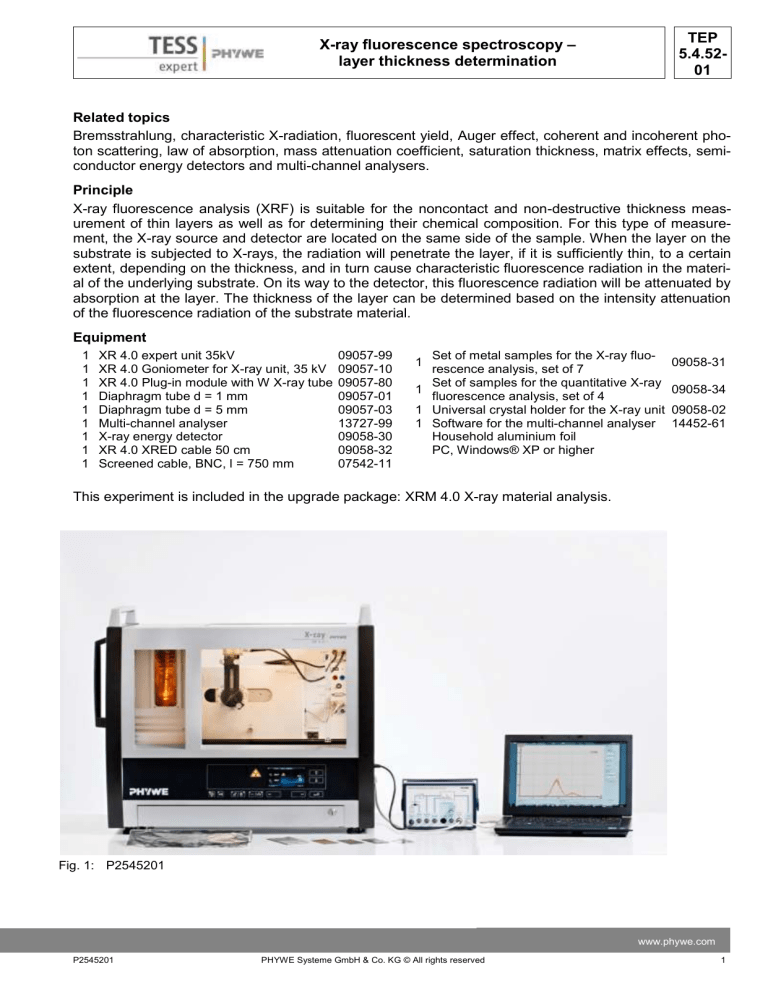
Fig. 1: P2545201
www.phywe.com
P2545201
PHYWE Systeme GmbH & Co. KG © All rights reserved
1
TEP
5.4.5201
X-ray fluorescence spectroscopy –
layer thickness determination
Tasks
1. Calibrate the semiconductor energy detector.
2. Measure fluorescence spectrum of the iron
substrate with different numbers n of pieces of
aluminium foil with the same thickness placed
on the substrate (including n = 0). Determine
the intensity of the Fe-Kα fluorescence line.
3. Plot the intensity of the Fe-Kα fluorescence line
as a function of the number of pieces of aluminium foil placed on the substrate in linear and
semilogarithmic way.
4. Determine the intensity of the Fe-Kα fluorescence line for various numbers of pieces of aluminium foil that are fastened in front of the
outlet of the tube of the energy detector.
5. Calculate the thickness of the aluminium foil.
6. Execute tasks 2 to 4 for copper foil on molybFig. 2: Connections in the experimentation area
denum or zinc substrate.
Set-up and procedure
Set-up (Fig. 1)
- Screw the adapter ring onto the inlet tube of
the energy detector.
- Connect the signal and supply cables to the
corresponding ports of the detector with the aid
Fig. 3: Connection at the external panel of the XR 4.0 Xof the right-angle plugs.
ray expert unit to the MCA
- Connect the signal and supply cables from the
MCA to the appropriate connections in the experiment chamber of the X-ray unit (signal caX-ray energy
ble: red, supply cable: green (see Fig. 2)).
detector
- Connect the external ports for the X RED of the
x-ray unit (signal cable red, supply cable green,
see Fig. 3) to the multi-channel analyse (MCA).
Connect the signal cable via a screened BNCcable to the “Input” port of the MCA and the
supply cable to the “X-Ray Energy Det.” port of
the MCA.
- Secure the energy detector in the holder of the
swivel arm of the goniometer. Lay the two cables with sufficient length so that the goniomeLeft position of the
ter can be swivelled freely over the entire swivgoniometer
Universal crystal
elling range.
holder with metal
- Connect the multi-channel analyser and comsample
puter with the aid of the USB cable.
- Insert the tube with the 2-mm-aperture.
- Bring the goniometer block and the detector to
their respective end positions on the left. Bring
the detector to the 90° position in the 2:1 coupling mode (Fig. 4).
Fig. 4: Set-up at the goniometer
2
PHYWE Systeme GmbH & Co. KG © All rights reserved
P2545201
X-ray fluorescence spectroscopy –
layer thickness determination
TEP
5.4.5201
Calibration of the multi-channel analyser
(if there is no other already existing calibration that
can be used)
- Bring the goniometer block and the detector to
their respective end positions on the right.
- Insert the tube with the 1mm-aperture into the
exit tube of the X-ray tube.
- With the X-ray unit switched on and the door
locked, bring the detector to the 0° position.
Then, shift the detector by some tenths degree
out of the zero position in order to reduce the
total rate.
Fig. 5: calibration of the multi-channel analyser
- Operating data of the tungsten X-ray tube: Select an anode voltage UA = 25 kV and an anode
current IA = 0.02 mA and confirm these values by pressing the “Enter” button.
- Switch on the X-radiation
- In the MEASURE program, select “Multi channel analyser” under “Gauge”. Then, select “Settings and
calibration”. After the “Calibrate” button has been clicked, a spectrum can be measured. The counting rate should be < 300 c/s. Energy calibration settings: - 2-point calibration, - Unit = keV, Gain = 2 –
Set the offset so that low-energy noise signals will be suppressed (usually a few per cent are sufficient), See Fig 5.
- Measuring time: 5 minutes. Use the timer of the X-ray unit.
- Make the two coloured calibration lines congruent with the line centres of the two characteristic X-ray
lines. The corresponding energy values (see e.g. P2544701) E(L3M5/L3M4) = 8,41 keV and E(L2N4) =
9,69 keV are entered into the corresponding fields, depending on the colour. (Note: Since a separation of the lines L3M5 and L3M4 Lines is not possible, the mean value of both lines is entered as the
energy of the line).
- Name and save the calibration.
Sample preparation
- Use a pair of scissors and cut approximately 1 x 2 cm pieces out of some household aluminium foil.
Prior to fastening them in the universal crystal holder, smooth them out with the tip of a finger.
- Prepare the pieces of copper foil in the same way.
Spectrum recording
- Insert the tube with the 2-mm-aperture.
- Bring the goniometer block and the detector to their respective end positions on the left. Bring the detector to the 90° position in the 2:1 coupling mode.
- Insert the iron sample with the universal crystal holder (sample at 45°).
- Operating data of the tungsten X-ray tube: Adjust an anode voltage Ua = 35 kV and an anode current
so that the counting rate is ≤ 200 c/s.
- Measuring time: 10 minutes (use the timer of the X-ray unit).
- Then, fasten the pieces of aluminium foil one after the other in the crystal holder above the iron sample. Record a spectrum for every new layer of foil.
- Use molybdenum or zinc as the substrate element for determining the thickness of the copper foil.
Evaluation of the measurement curves
www.phywe.com
P2545201
PHYWE Systeme GmbH & Co. KG © All rights reserved
3
TEP
5.4.5201
-
X-ray fluorescence spectroscopy –
layer thickness determination
In order to determine the line energy, switch from the bar display to the curve display. To do so, click
“Display options” and then “Interpolation and straight lines”.
Extend the relevant line section with the zoom function
. Open the window “Function fitting
-
Then, select the curve section with
normal distribution”.
-
Find the intensity of the normal distribution with “Peak analysis”
”. Then, select “Scaled
.
Theory and Evaluation
When a material is irradiated with X-rays, the thickness of the material can be determined based on the
intensity attenuation of the X-ray that is allowed through the material. This method is not suitable, however, for determining the thickness of electroplated coatings that are applied to a massive substrate that
completely absorbs the radiation. These kinds of problems can be solved with the aid of the X-ray fluorescence method during which the fluorescence radiation of the applied layer, which is stimulated by the
primary radiation, is detected in the backscatter mode.
In this case, however, numerous other factors (coherent-incoherent scattering, attenuation of the normally polychromatic primary radiation in the layer, fluorescent yield, attenuation of the produced fluorescence radiation in the layer, geometric factors, and matrix effects), which are partly difficult to quantify,
must be taken into consideration. This is why, in practical applications, computer-assisted evaluation
methods are applied. In this case, calibrated standard functions are stored in the system for every
measurement problem.
If, on the other hand, the layer to be examined is sufficiently thin so that the primary radiation is less absorbed by it, the substrate material can be stimulated to emit fluorescence radiation. On its way to the
detector, this radiation is only attenuated by the overlying layer as a function of its thickness.
If IF0 is the intensity of the characteristic fluorescence radiation of the pure substrate, the following applies to the radiation intensity IFx that passes through the overlying layer of the thickness x:
I Fx I F 0 e l x μl = linear absorption coefficient
(1)
The linear absorption coefficient μl (dimension: cm-1) is dependent on the energy of the radiation as well
as on the density ρ of the absorbing element. In order to become independent of the density of the absorbing element (which is a solid, liquid, or gas), one uses the so-called mass absorption coefficient μl/ρ
(dimension cm2/g), which, for an element, then only depends on its atomic number and on the energy of
the radiation. With
l /
(2)
equation (1) leads to:
I Fx I F 0 e
x
(3)
Evaluation of the aluminium foil
Task 2:
Figure 6 shows the decrease in the intensity of the characteristic fluorescence radiation of an iron substrate for various numbers of pieces of aluminium foil of the identical thickness d, which are placed on
the substrate. The energy of the characteristic fluorescence radiation of the aluminium layers (EAl-Kα ≈
1.5 keV) is below the sensitivity limit of the semiconductor detector, which is why it cannot be measured.
4
PHYWE Systeme GmbH & Co. KG © All rights reserved
P2545201
X-ray fluorescence spectroscopy –
layer thickness determination
TEP
5.4.5201
Fig. 6: Fe-fluorescence lines as a function of the number n of the pieces of aluminium foils placed on the substrate
Task 3:
Figure 7 shows the exponential decrease in the intensity of the Fe-Kα-line as a function of the number of
pieces of aluminium foil that are placed on the substrate.
Figure 8 shows the course of the normalised intensity in a semilogarithmic representation.
Task 4
For the determination of the layer thickness d of the pieces of foil, the following must be taken into consideration:
1. The fluorescence radiation of the substrate is measured by the detector at an angle of 45° with regard to the surface normal of the substrate (see Fig. 9). This means that the absorbing thickness of
the overlying foil is x = d· √2.
𝑙𝑛
Fig. 7: Intensity of the Fe-Kα-fluorescence line as a
function of the number n of the pieces of aluminium foil placed on the substrate
𝐼(𝑛)
𝐼0
Fig. 8: Normalised intensity of the Fe-Kα-fluorescence
line in a semilogarithmic representation as a
function of the number n of the pieces of aluminium foil placed on the substrate
www.phywe.com
P2545201
PHYWE Systeme GmbH & Co. KG © All rights reserved
5
TEP
5.4.5201
X-ray fluorescence spectroscopy –
layer thickness determination
2. The intensity IF of the produced fluorescence radiation is proportional to the intensity Ip0 of the primary beam. However, since the primary beam is also absorbed by the pieces of foil, the intensity-reduced primary beam intensity Ip0r
must be used for the calculation. For this
purpose, various numbers of pieces of
foil are fastened in front of the outlet of
the tube with the aid of some adhesive
tape (see Fig. 10). Then, the fluorescence signal of the substrate must be
determined. The resulting normalised
curves in Figure 11 are used to determine the intensity attenuation with the
factor √2. As is shown in Figure 11, the
decrease in the primary intensity for aluminium with 4 pieces of foil (absorption Fig. 9: Schematic representation of the radiation gethickness x = 4d √2 is Ip0r = 0.87 Ip0. In ometry (S = substrate, F = foil, Ip0 = primary beam intensity, Ip0 r primary beam intensity that is reduced by
order to determine the layer thickness of
absorption in the foil, and IF = fluorescence intensity of
the foil with the aid of (3), this means
the substrate).
that IFx = IF / 0.87, with IF being the
measured fluorescence intensity of the
substrate. For the determination of the thickness of the aluminium foil with the aid of (3), only the FeKα-line was used. Table 1 shows the evaluation of the spectra.
The background intensity has already been deducted for the peak intensities that are stated in column B.
Column E shows the effective total thickness x = n · d · √2 of the pieces of aluminium foil that were
placed on the substrate. It must be taken into consideration that the Fe-fluorescence radiation is measured at an angle of 45° with regard to the surface normal of the detector (see Fig. 9).
Fig. 10: Schematic representation of the radiation geometry for determining the attenuation of the primary
beam intensity (S = substrate, F = foil, Bl = tube, Ip0 /
Ipr = primary beam intensity before/after the absorption,
and IF = fluorescence intensity of the substrate).
6
Fig. 11: Attenuation of the primary beam intensity by
various numbers n of the aluminium and copper
foils.
PHYWE Systeme GmbH & Co. KG © All rights reserved
P2545201
X-ray fluorescence spectroscopy –
layer thickness determination
TEP
5.4.5201
Table 1: Determination of the thickness of the aluminium foil (witht ρAl = 2,7 gcm-3 and μAl = 92,8 cm2g-1
E(Fe)-Kα = 6,4 keV).
A
B
C
D
number of foils
IFx / Imp.
E
x = n∙d√2 / μm
F
d = x/n√2 / μm
IF / Imp.
Ip0r √2 / Ip0(0)
742
459
286
178
103
64
41
24
1
0,97
0,93
0,90
0,87
0,84
0,80
0,77
473
308
198
118
76
51
31
18,0
35,1
52,7
73,4
90,9
106,9
126,7
12,7
12,4
12,4
13,0
12,9
12,6
12,8
n
0
1
2
3
4
5
6
7
Task 5
The values for the thickness d of an individual piece of foil are shown in column F. If one calculates the
mean of the values in column F, the following results for the thickness of the aluminium foil:
d = 12.7 μm (values stated on the packaging by the manufacturer: d = 13 μm).
Evaluation of the copper foil
Figure 12 shows the fluorescence spectra of the molybdenum substrate with copper foils. Here, too, the
characteristic fluorescence radiation of the foil material must be measured.
Figure 13 shows the normalised intensity of the Kα-lines of molybdenum and copper as a function of the
number of copper foils. After 6 to 7 layers of copper foil, the saturation thickness is already reached.
Fig. 12: Mo- and Cu-fluorescence lines as a function of the number n of the copper foils placed on the substrate.
www.phywe.com
P2545201
PHYWE Systeme GmbH & Co. KG © All rights reserved
7
TEP
5.4.5201
X-ray fluorescence spectroscopy –
layer thickness determination
𝐼(𝑛)
𝐼0
Table 2 shows the evaluation of the spectra for determining the thickness of the copper foil.
The mean value of the copper foil thickness is: d =
7.8 μm (value stated by the manufacturer: d = 7.6
μm). The thickness values (column G) have a falling tendency when the number of foils increases.
This indicates that the method of the direct thickness determination can only be applied to a limited
extent.
If one, however, assigns the real thickness values
to the x-axes in Figures 7 and 13, the curves can Fig. 13: Exponential course of the intensity of the Kαbe used as calibration functions.
fluorescence lines of molybdenum and copper
as a function of the number n of the copper foils
placed on the substrate.
Table 2: Determination of the thickness of the copper foil (intensities stated without any
background signal) (with ρCu = 8,96 gcm-3 and μCu = 49,7 cm2g-1 for E(Mo)-Kα= 17,4 keV).
A
number of
foils n
0
1
2
3
4
5
6
8
B
C
Cu-Kα
IF / Imp.
IF / Imp.
0
1202
1455
1546
1576
1569
1579
330
155
76
40
21
15
8
D
Ip0r √2 /
Ip0(0)
0,83
0,68
0,56
0,46
0,38
0,31
E
Mo- Kα
IFx / Imp.
187
112
71
46
40
26
PHYWE Systeme GmbH & Co. KG © All rights reserved
F
G
x = n∙d√2 / μm d = x/n√2 / μm
12,8
24,3
34,5
44,2
47,4
57,1
9,0
8,6
8,1
7,8
6,7
6,7
P2545201


