Section 4.3: Bivariate Data Important Dates and Grades
advertisement
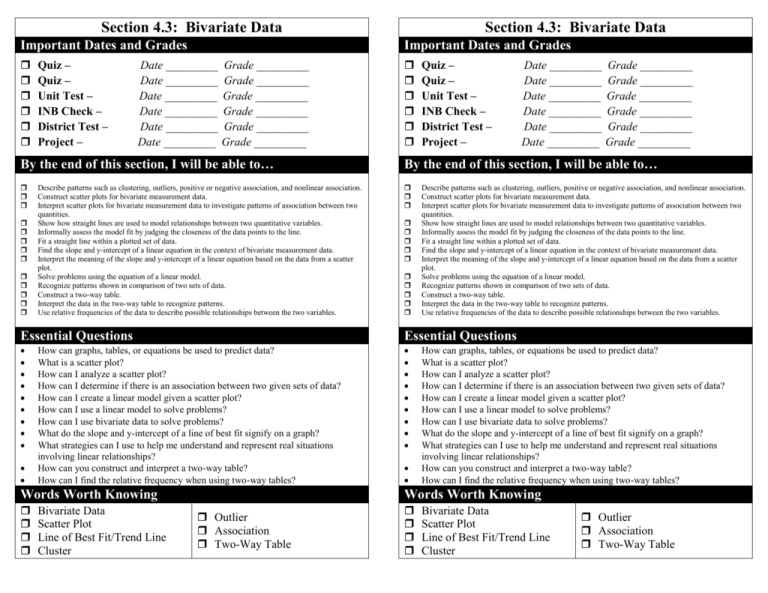
Section 4.3: Bivariate Data Section 4.3: Bivariate Data Important Dates and Grades Important Dates and Grades Quiz – Quiz – Unit Test – INB Check – District Test – Project – Date _________ Grade _________ Date _________ Grade _________ Date _________ Grade _________ Date _________ Grade _________ Date _________ Grade _________ Date _________ Grade _________ Quiz – Quiz – Unit Test – INB Check – District Test – Project – Date _________ Grade _________ Date _________ Grade _________ Date _________ Grade _________ Date _________ Grade _________ Date _________ Grade _________ Date _________ Grade _________ By the end of this section, I will be able to… By the end of this section, I will be able to… Describe patterns such as clustering, outliers, positive or negative association, and nonlinear association. Construct scatter plots for bivariate measurement data. Interpret scatter plots for bivariate measurement data to investigate patterns of association between two quantities. Show how straight lines are used to model relationships between two quantitative variables. Informally assess the model fit by judging the closeness of the data points to the line. Fit a straight line within a plotted set of data. Find the slope and y-intercept of a linear equation in the context of bivariate measurement data. Interpret the meaning of the slope and y-intercept of a linear equation based on the data from a scatter plot. Solve problems using the equation of a linear model. Recognize patterns shown in comparison of two sets of data. Construct a two-way table. Interpret the data in the two-way table to recognize patterns. Use relative frequencies of the data to describe possible relationships between the two variables. Describe patterns such as clustering, outliers, positive or negative association, and nonlinear association. Construct scatter plots for bivariate measurement data. Interpret scatter plots for bivariate measurement data to investigate patterns of association between two quantities. Show how straight lines are used to model relationships between two quantitative variables. Informally assess the model fit by judging the closeness of the data points to the line. Fit a straight line within a plotted set of data. Find the slope and y-intercept of a linear equation in the context of bivariate measurement data. Interpret the meaning of the slope and y-intercept of a linear equation based on the data from a scatter plot. Solve problems using the equation of a linear model. Recognize patterns shown in comparison of two sets of data. Construct a two-way table. Interpret the data in the two-way table to recognize patterns. Use relative frequencies of the data to describe possible relationships between the two variables. Essential Questions Essential Questions How can graphs, tables, or equations be used to predict data? What is a scatter plot? How can I analyze a scatter plot? How can I determine if there is an association between two given sets of data? How can I create a linear model given a scatter plot? How can I use a linear model to solve problems? How can I use bivariate data to solve problems? What do the slope and y-intercept of a line of best fit signify on a graph? What strategies can I use to help me understand and represent real situations involving linear relationships? How can you construct and interpret a two-way table? How can I find the relative frequency when using two-way tables? Words Worth Knowing Bivariate Data Scatter Plot Line of Best Fit/Trend Line Cluster How can graphs, tables, or equations be used to predict data? What is a scatter plot? How can I analyze a scatter plot? How can I determine if there is an association between two given sets of data? How can I create a linear model given a scatter plot? How can I use a linear model to solve problems? How can I use bivariate data to solve problems? What do the slope and y-intercept of a line of best fit signify on a graph? What strategies can I use to help me understand and represent real situations involving linear relationships? How can you construct and interpret a two-way table? How can I find the relative frequency when using two-way tables? Words Worth Knowing Outlier Association Two-Way Table Bivariate Data Scatter Plot Line of Best Fit/Trend Line Cluster Outlier Association Two-Way Table


