Animal Olympics (Rates)
advertisement
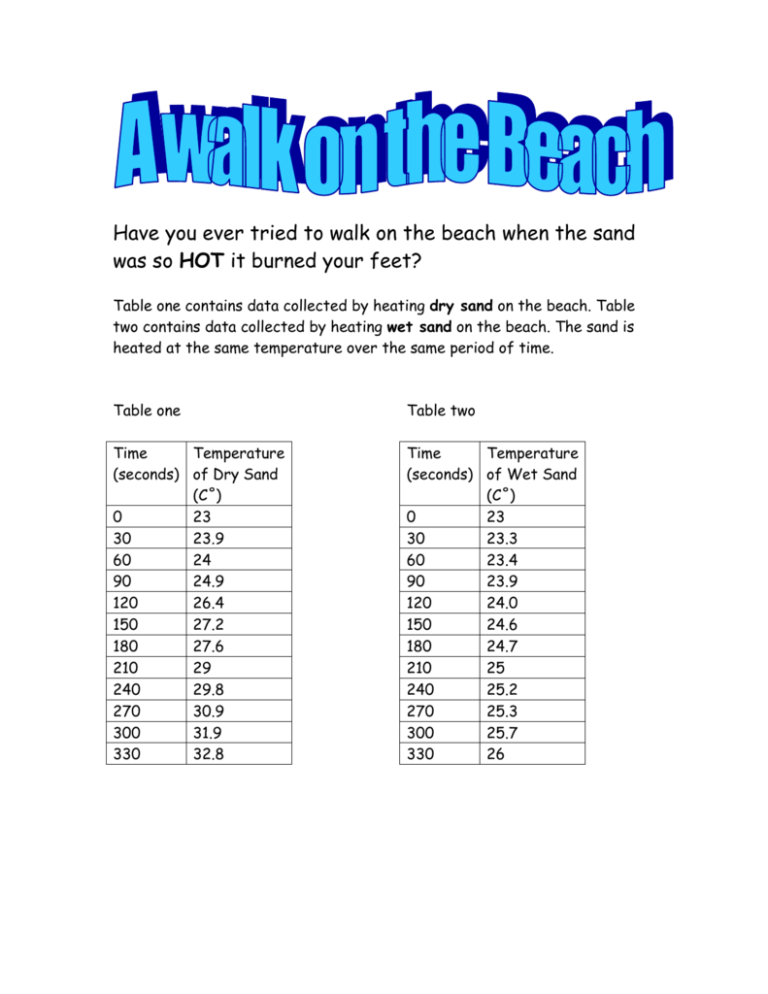
Have you ever tried to walk on the beach when the sand was so HOT it burned your feet? Table one contains data collected by heating dry sand on the beach. Table two contains data collected by heating wet sand on the beach. The sand is heated at the same temperature over the same period of time. Table one Table two Time Temperature (seconds) of Dry Sand (C˚) 0 23 30 23.9 60 24 90 24.9 120 26.4 150 27.2 180 27.6 210 29 240 29.8 270 30.9 300 31.9 330 32.8 Time Temperature (seconds) of Wet Sand (C˚) 0 23 30 23.3 60 23.4 90 23.9 120 24.0 150 24.6 180 24.7 210 25 240 25.2 270 25.3 300 25.7 330 26 Name _______________________ Instructions: Graph the data from table one-dry sand- on a coordinate plane (use a colored pencil). Choose a scale and interval for the graph. Label the x-axis and the y-axis. Now graph the data from table two-wet sand- on the same coordinate plane (use a different colored pencil). After you have properly graphed the data, let a partner look at your graph. Then, Answer the following questions about your graph: 1. Which variable did you put on the x-axis? ___________________ Which variable did you put on the y-axis? _____________ 2. Which variable is the independent variable? ___________________ Which variable is the dependent variable? ____________________ Explain why you think this. ____________________________________ _________________________________________________________ 3. Would it make sense to connect the points on this graph? Why or why not? _____________________________________________________ 4. Explain how the temperature of sand changed over time. _____________ 5. Compare and contrast how the graphs are similar and different. Dry Sand Both Wet Sand ___________ 6. Explain why dry sand heats faster than wet sand. __________________ 7. If I were going to go walk on the beach, and I did not want to burn my feet, explain to me where I should walk. _________________________________________________________ _________________________________________________ (Title)

