Table S13
advertisement
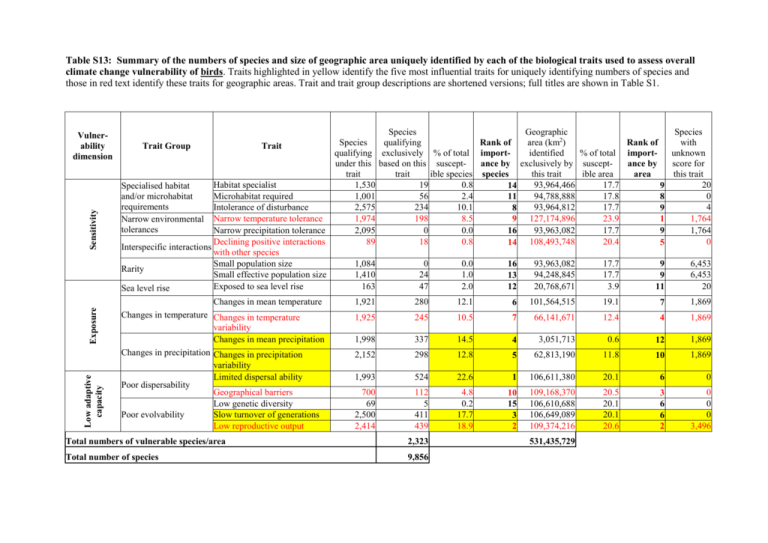
Table S13: Summary of the numbers of species and size of geographic area uniquely identified by each of the biological traits used to assess overall climate change vulnerability of birds. Traits highlighted in yellow identify the five most influential traits for uniquely identifying numbers of species and those in red text identify these traits for geographic areas. Trait and trait group descriptions are shortened versions; full titles are shown in Table S1. Low adaptive capacity Exposure Sensitivity Vulnerability dimension Trait Group Trait Habitat specialist Microhabitat required Intolerance of disturbance Narrow temperature tolerance Narrow precipitation tolerance Declining positive interactions Interspecific interactions with other species Small population size Rarity Small effective population size Exposed to sea level rise Sea level rise Specialised habitat and/or microhabitat requirements Narrow environmental tolerances Species Species qualifying qualifying exclusively % of total under this based on this suscepttrait trait ible species 1,530 19 0.8 1,001 56 2.4 2,575 234 10.1 1,974 198 8.5 2,095 0 0.0 89 18 0.8 Geographic Species area (km2) with Rank of Rank of identified % of total importunknown importscore for ance by exclusively by susceptance by this trait ible area this trait species area 93,964,466 17.7 20 14 9 94,788,888 17.8 0 11 8 93,964,812 17.7 4 8 9 23.9 1,764 9 127,174,896 1 93,963,082 17.7 1,764 16 9 20.4 0 14 108,493,748 5 1,084 1,410 163 0 24 47 0.0 1.0 2.0 16 13 12 93,963,082 94,248,845 20,768,671 17.7 17.7 3.9 9 9 11 6,453 6,453 20 Changes in mean temperature 1,921 280 12.1 6 101,564,515 19.1 7 1,869 Changes in temperature Changes in temperature variability Changes in mean precipitation Changes in precipitation Changes in precipitation variability Limited dispersal ability Poor dispersability Geographical barriers Low genetic diversity Poor evolvability Slow turnover of generations Low reproductive output 1,925 245 10.5 7 66,141,671 12.4 4 1,869 1,998 337 14.5 4 3,051,713 0.6 12 1,869 2,152 298 12.8 5 62,813,190 11.8 10 1,869 1,993 524 22.6 1 106,611,380 20.1 6 0 700 69 2,500 2,414 112 5 411 439 4.8 0.2 17.7 18.9 10 15 3 2 109,168,370 106,610,688 106,649,089 109,374,216 20.5 20.1 20.1 20.6 3 6 6 2 0 0 0 3,496 Total numbers of vulnerable species/area 2,323 Total number of species 9,856 531,435,729
