Chemical Equilibrium Worksheet: ICE Tables & Kc Calculations
advertisement
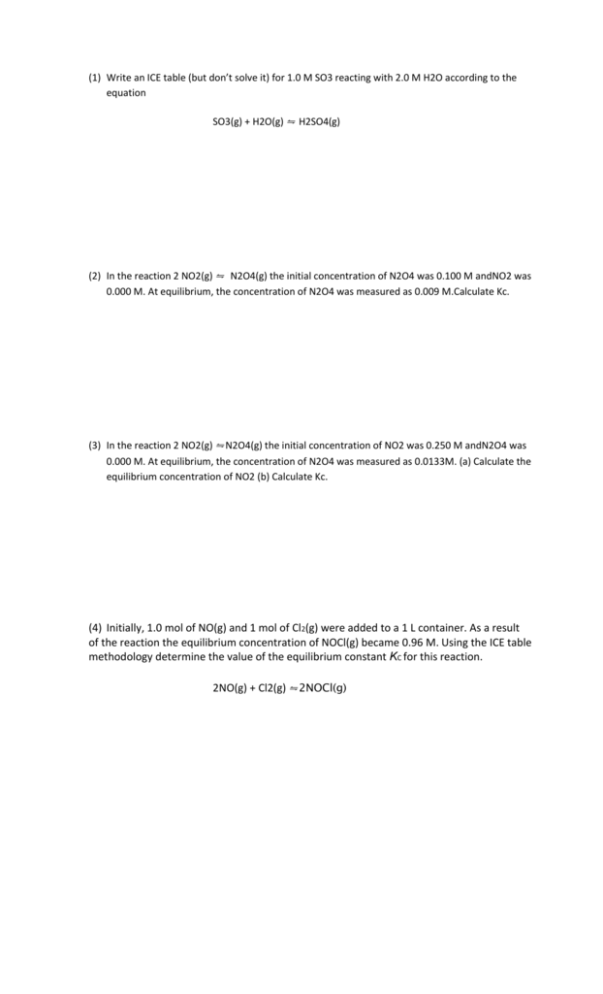
(1) Write an ICE table (but don’t solve it) for 1.0 M SO3 reacting with 2.0 M H2O according to the equation SO3(g) + H2O(g) ⇋ H2SO4(g) (2) In the reaction 2 NO2(g) ⇋ N2O4(g) the initial concentration of N2O4 was 0.100 M andNO2 was 0.000 M. At equilibrium, the concentration of N2O4 was measured as 0.009 M.Calculate Kc. (3) In the reaction 2 NO2(g) ⇋N2O4(g) the initial concentration of NO2 was 0.250 M andN2O4 was 0.000 M. At equilibrium, the concentration of N2O4 was measured as 0.0133M. (a) Calculate the equilibrium concentration of NO2 (b) Calculate Kc. (4) Initially, 1.0 mol of NO(g) and 1 mol of Cl2(g) were added to a 1 L container. As a result of the reaction the equilibrium concentration of NOCl(g) became 0.96 M. Using the ICE table methodology determine the value of the equilibrium constant KC for this reaction. 2NO(g) + Cl2(g) ⇋2NOCl(g) (5) Initially 1.50 moles of N2(g) and 3.50 moles of H2(g) were added to a 1 L container at 700 °C. As a result of the reaction the equilibrium concentration of NH3(g) became 0.540 M. (a) What is the value of the equilibrium constant for this reaction at the given temperature of 700 °C. N2(g) + 3H2(g) ⇋ 2NH3(g) In the above reaction we can monitor the change in concentration of reactants over time (just as we discussed when dealing with kinetics) and we can plot the data as follows: (b) Label each data plot as either[H2],[N2] or[NH3]. (c) Why does one data plot show an initial positive slope whereas the other two data plots show initial negative slopes? (d) Why does the uppermost plot have a steeper initial slope than the middle plot. (e) At which time a, b, c or d is an equilibrium state reached? (ii) The equilibrium constant for this reaction was calculated as shown below. What is Kc for the reverse reaction? (6) . (7) . (8) A 1.5 mol sample of CaCO3 is placed into an evacuated 2.0L flask and heated to 400K. At equilibrium, there is 0.400L of CO2(g) present in the flask. Calculate K for this equilibrium. CaCO3(s) ⇋CaO(s) + CO2(g)
