Mini Lesson 5 (PRAC) Penobscot River Flow
Data Literacy Project
ML5-PRAC_PenobscotR_Flow.docx 21NOV2013
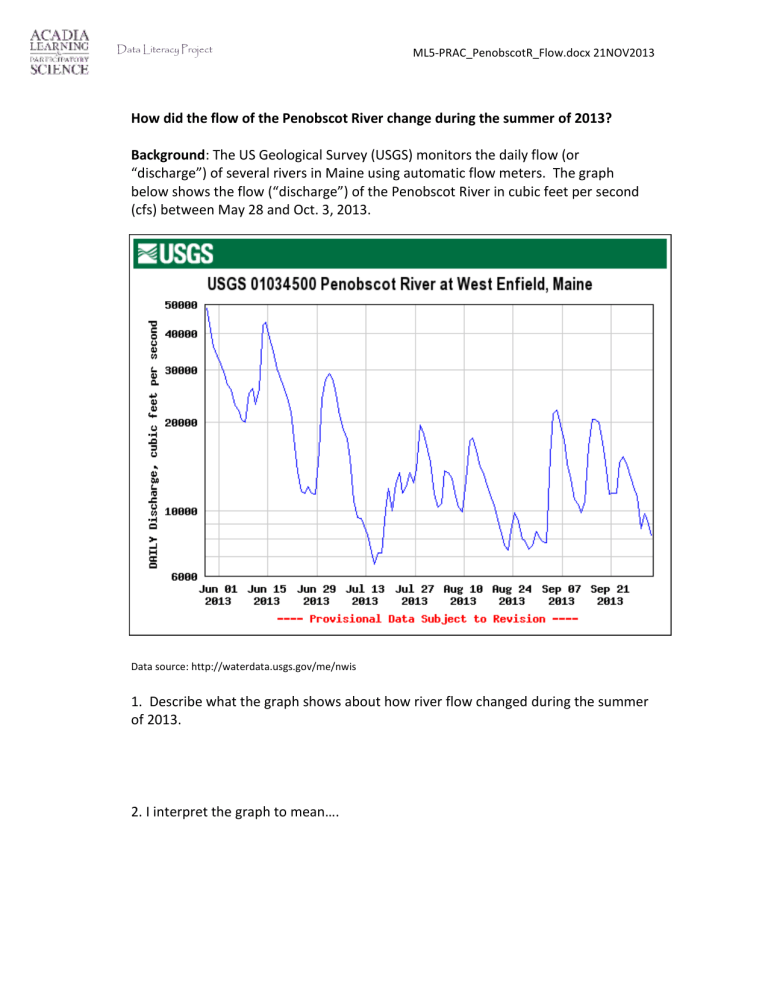
How did the flow of the Penobscot River change during the summer of 2013?
Background: The US Geological Survey (USGS) monitors the daily flow (or
“discharge”) of several rivers in Maine using automatic flow meters. The graph below shows the flow (“discharge”) of the Penobscot River in cubic feet per second
(cfs) between May 28 and Oct. 3, 2013.
Data source: http://waterdata.usgs.gov/me/nwis
1. Describe what the graph shows about how river flow changed during the summer of 2013.
2. I interpret the graph to mean….
ML5-PRAC_PenobscotR_Flow.docx 21NOV2013
Teaching notes:
(Purpose here is to elicit description of what the graph shows. Sample response: On May 28 the river flow was 50,000 cfs and then it decreased unevenly to a low point in mid July. There were two big increases around June 15 and June 30, and each time the flow dropped to lower than it was before.
Between mid July and October it didn’t have an overall trend, but it did increase and decrease between
5000 and 20,000 cfs several times)
[ Purpose here is to elicit an explanation (e.g. of the pattern or variability) or interpretation of the meaning in terms of the context of the question. [Sample response: The increases in flow might be when it rains. We could look at rainfall data to see if the timing matches.]


