Learning Goal and Scale and Sequenced Learning Targets
advertisement

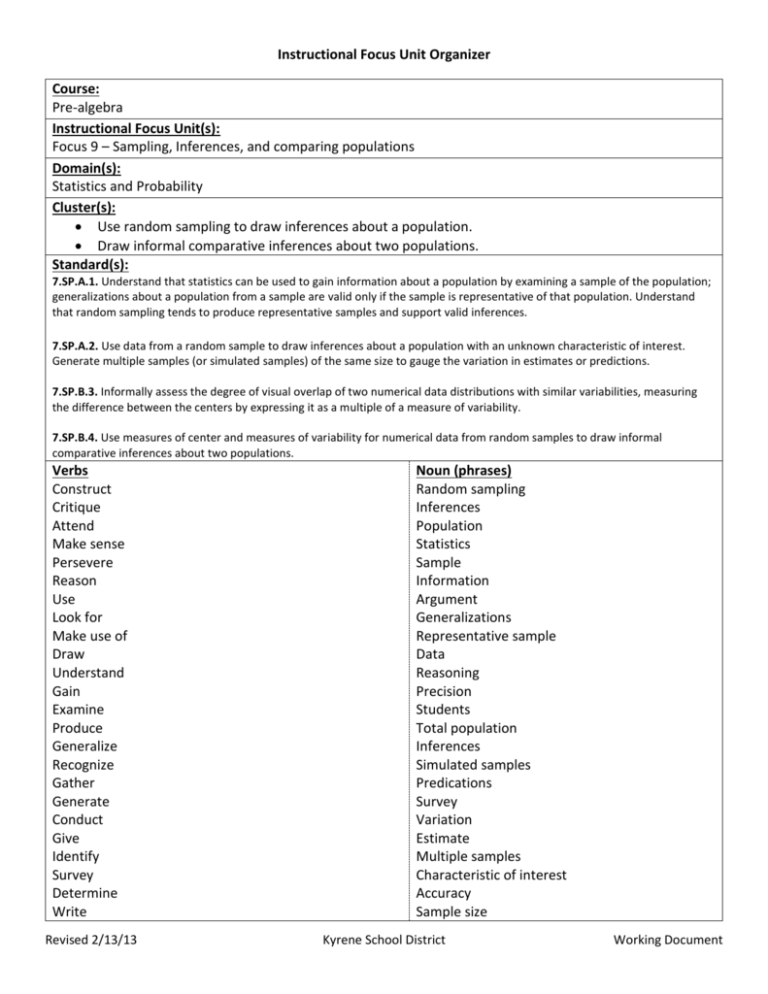
Instructional Focus Unit Organizer Course: Pre-algebra Instructional Focus Unit(s): Focus 9 – Sampling, Inferences, and comparing populations Domain(s): Statistics and Probability Cluster(s): Use random sampling to draw inferences about a population. Draw informal comparative inferences about two populations. Standard(s): 7.SP.A.1. Understand that statistics can be used to gain information about a population by examining a sample of the population; generalizations about a population from a sample are valid only if the sample is representative of that population. Understand that random sampling tends to produce representative samples and support valid inferences. 7.SP.A.2. Use data from a random sample to draw inferences about a population with an unknown characteristic of interest. Generate multiple samples (or simulated samples) of the same size to gauge the variation in estimates or predictions. 7.SP.B.3. Informally assess the degree of visual overlap of two numerical data distributions with similar variabilities, measuring the difference between the centers by expressing it as a multiple of a measure of variability. 7.SP.B.4. Use measures of center and measures of variability for numerical data from random samples to draw informal comparative inferences about two populations. Verbs Construct Critique Attend Make sense Persevere Reason Use Look for Make use of Draw Understand Gain Examine Produce Generalize Recognize Gather Generate Conduct Give Identify Survey Determine Write Revised 2/13/13 Noun (phrases) Random sampling Inferences Population Statistics Sample Information Argument Generalizations Representative sample Data Reasoning Precision Students Total population Inferences Simulated samples Predications Survey Variation Estimate Multiple samples Characteristic of interest Accuracy Sample size Kyrene School District Working Document Gauge Estimate Random sampling Predict Collect Answer Address Assess Measure Express Research Find Utilize Calculate Connect Decide Compare Include observe persuade Unknown characteristics Visual overlap Structure Difference Measure of variability – range, MAD, interquartile range Statistic functions Measures of central tendency – mean, median, mode Data sets Distribution Comparative inferences Numerical data Standard deviation Dot plot Sense of problem Viable argument Tools Graphing calculators Spreadsheets Computations Student will be able to: Explain how statistics can be used to gain information about a population Sample a population Make generalizations about population from a sample Support valid/invalid inferences Identify if a sample is representative of a population Explain how random samples can produce representative samples and support valid inferences. Recognize the difficulty to gather statistics on an entire population Draw inferences from data Describe what random sampling is and how it is used to get accurate results Construct viable arguments Critique the reasoning of others Attend to precision draw inferences about a population with unknown characteristic of interest using data from a random sample generate multiple samples of the same size Student will understand: Understand the statistics can be used to gain information about a population by examining a sample of the population Understand generalizations about a population from a sample are valid only if the sample is representative of that population Understand that random sampling tends to produce representative samples & support valid inferences Understand that a random sample guarantees that each element of the population has an equal opportunity to be selected in the sample Understand the benefit of each method of analyzing data with both measures of center and measures of variability Revised 2/13/13 Kyrene School District Working Document gauge the variation in estimates or predictions from a sample collect & use multiple samples of data to answer questions about a population make sense of problems persevere in solving them reason abstractly & quantitatively use appropriate tools strategically look for & make use of structure assess the degree of visual overlap of two numerical data distributions with similar variabilities measure the difference between the centers by expressing it as a multiple of a measure of variability utilize statistical functions in a graphing calculator or spreadsheet for calculations with larger data sets to check computations calculate mean absolute deviations analyze data sets to connect the mathematics to their interests and other academic subjects create & analyze visual representations (dot plots, bar graphs, box & whisker, circle graphs, stem & leaf plot, histogram) to compare multiple measures of data draw informal comparative inferences about two population using measures of center and measures of variability for numerical data. Compare 2 sets of data using measures of center & variability Persuade both sides of an argument when comparing 2 sets of data Calculate measures of center – mean, median, mode Calculate measures of variability – range, mean absolution deviation, interquartile range Revised 2/13/13 Kyrene School District Working Document Revised Learning Goal(s) : Students will be able to use random sampling to draw inferences about a population and explain how statistics can be used to support their inferences. Learning Scale(s): 4 In addition to level 3.0 and above and beyond what was taught in class, student may: Make connection with other concepts in math Make connection with other content areas. 3 Students will be able to use random sampling to draw inferences about a population and explain how statistics can be used to support their inferences. Explain how random samples can produce representative samples and support valid inferences. 2 Students will be able to use random sampling to draw inferences about a population. Collect & use multiple samples of data to answer questions about a population Identify if a sample is representative of a population Survey a population to get a sample 1 With help from the teacher, student has partial success with the level 2.0 & 3.0 0 Even with help, student has no success with the unit content. Sequenced targets 7.SP.1 & 7.SP.2- One Population Describe what random sampling is and how it is used to get accurate results Draw inferences from data Identify if a sample is representative of a population draw inferences about a population with unknown characteristic of interest using data from a random sample Recognize the difficulty to gather statistics on an entire population Survey a population to get a sample generate multiple samples of the same size collect & use multiple samples of data to answer questions about a population Revised 2/13/13 Kyrene School District Working Document Make generalizations about population from a sample gauge the variation in estimates or predictions from a sample Support valid/invalid inferences Explain how statistics can be used to gain information about a population Explain how random samples can produce representative samples and support valid inferences. Understand the statistics can be used to gain information about a population by examining a sample of the population Understand generalizations about a population from a sample are valid only if the sample is representative of that population Understand that random sampling tends to produce representative samples & support valid inferences Understand that a random sample guarantees that each element of the population has an equal opportunity to be selected in the sample Revised 2/13/13 Kyrene School District Working Document Revised Learning Goal(s) : Students will be able to draw comparative inferences about two populations and explain how statistics can be used to support their inferences. Learning Scale(s): 4 In addition to level 3.0 and above and beyond what was taught in class, student may: Make connection with other concepts in math Make connection with other content areas. 3 Students will be able to draw comparative inferences about two populations and explain how statistics can be used to support their inferences. 2 Students will be able to draw comparative inferences about two populations. Revised 2/13/13 Analyze visual representations (dot plots, bar graphs, box & whisker, circle graphs, stem & leaf plot, histogram, table) to compare multiple measures of data Explain benefit of analyzing data with the measures of center and measures of variability Calculate measures of variability – range, mean absolution deviation, interquartile range Compare 2 sets of data using measures of center & variability create visual representations (dot plots, bar graphs, box & whisker, circle graphs, stem & leaf plot, histogram) to compare multiple measures of data Kyrene School District 1 With help from the teacher, student has partial success with the level 2.0 & 3.0 0 Even with help, student has no success with the unit content. Working Document Throughout the unit: Construct viable arguments Critique the reasoning of others Attend to precision make sense of problems persevere in solving them reason abstractly & quantitatively use appropriate tools strategically look for & make use of structure 7.SP.3 & 7.SP.4- Two Populations Calculate measures of variability – range, mean absolution deviation, interquartile range Calculate measures of center – mean, median, mode Compare 2 sets of data using measures of center & variability draw informal comparative inferences about two population using measures of center and measures of variability for numerical data. create visual representations (dot plots, bar graphs, box & whisker, circle graphs, stem & leaf plot, histogram) to compare multiple measures of data measure the difference between the centers by expressing it as a multiple of a measure of variability Persuade both sides of an argument when comparing 2 sets of data create & analyze visual representations (dot plots, bar graphs, box & whisker, circle graphs, stem & leaf plot, histogram) to compare multiple measures of data assess the degree of visual overlap of two numerical data distributions with similar variabilities utilize statistical functions in a graphing calculator or spreadsheet for calculations with larger data sets to check computations Understand the benefit of each method of analyzing data with both measures of center and measures of variability Revised 2/13/13 Kyrene School District Working Document Assessment(s): Resources/Materials: Next Steps: What? Revised 2/13/13 Who? Kyrene School District When? Working Document


