infographic assignment
advertisement
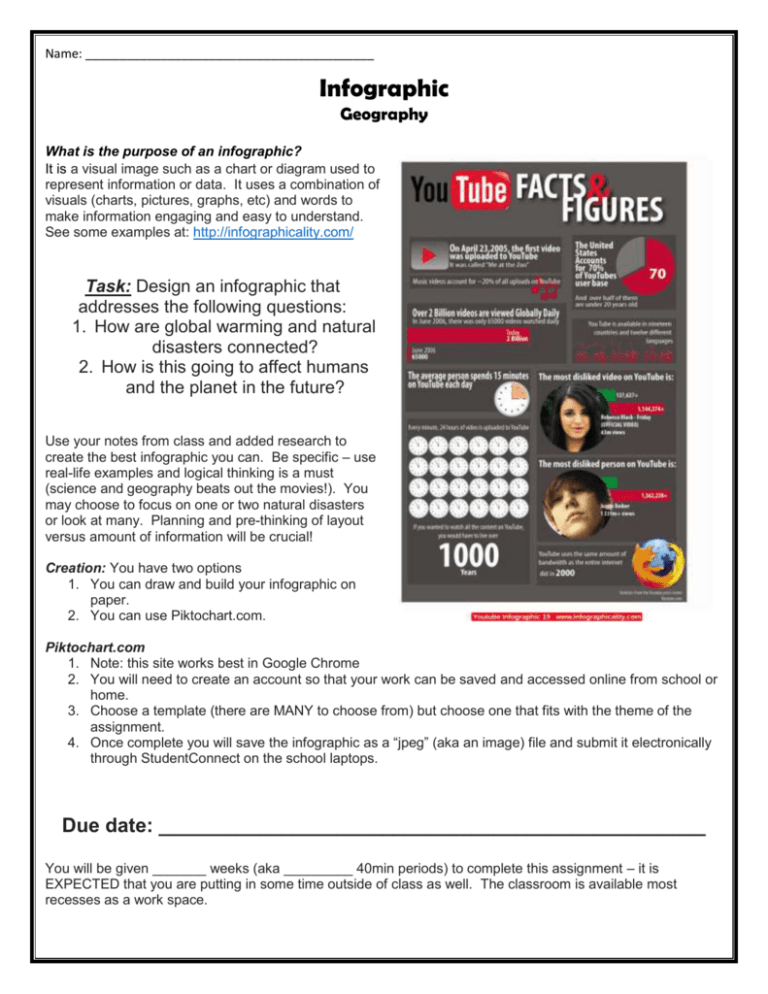
Name: __________________________________________ Infographic Geography What is the purpose of an infographic? It is a visual image such as a chart or diagram used to represent information or data. It uses a combination of visuals (charts, pictures, graphs, etc) and words to make information engaging and easy to understand. See some examples at: http://infographicality.com/ Task: Design an infographic that addresses the following questions: 1. How are global warming and natural disasters connected? 2. How is this going to affect humans and the planet in the future? Use your notes from class and added research to create the best infographic you can. Be specific – use real-life examples and logical thinking is a must (science and geography beats out the movies!). You may choose to focus on one or two natural disasters or look at many. Planning and pre-thinking of layout versus amount of information will be crucial! Creation: You have two options 1. You can draw and build your infographic on paper. 2. You can use Piktochart.com. Piktochart.com 1. Note: this site works best in Google Chrome 2. You will need to create an account so that your work can be saved and accessed online from school or home. 3. Choose a template (there are MANY to choose from) but choose one that fits with the theme of the assignment. 4. Once complete you will save the infographic as a “jpeg” (aka an image) file and submit it electronically through StudentConnect on the school laptops. Due date: _________________________________________________ You will be given _______ weeks (aka _________ 40min periods) to complete this assignment – it is EXPECTED that you are putting in some time outside of class as well. The classroom is available most recesses as a work space. Name: ____________________________________________ McLeod Coulter Kenney Somers-Smith Global Warming and Natural Disaster Infographic Criteria Knowledge and Understanding Thinking Communication Application Learning Skills: Responsibility Level 1 Demonstrates a limited understanding of: • the effects of global warming • Creation of natural disasters • Information and pictures make sense together, rarely. • Planning of the layout of the infographic and its components is evident, rarely. • Answers to the given questions are rarely communicated clearly. • Conventions are rarely used. • Layout is rarely easy to follow. • Effectively connects global warming and natural disasters and applies the effects to humans and the planet, with limited effectiveness. Assignment is not handed in on time. Level 2 Demonstrates some understanding of: • the effects of global warming • Creation of natural disasters • Information and pictures make sense together, some of the time. • Planning of the layout of the infographic and its components is evident, some of the time. • Answers to the given questions are communicated clearly, some of the time. • Conventions are used some of the time. • Layout is occasionally easy to follow. • Effectively connects global warming and natural disasters and applies the effects to humans and the planet, with some effectiveness. ---- Level 3 Demonstrates a good understanding of: • the effects of global warming • Creation of natural disasters • Information and pictures make sense together, most of the time. • Planning of the layout of the infographic and its components is evident, most of the time. • Answers to the given questions are communicated clearly, most of the time. • Conventions are used most of the time. • Layout is easy to follow. • Effectively connects global warming and natural disasters and applies the effects to humans and the planet, with considerable effectiveness. ---- Level 4 Demonstrates a thorough understanding of: • the effects of global warming • Creation of natural disasters • Information and pictures make sense together, all of the time. • Planning of the layout of the infographic and its components is evident, all of the time. • Answers to the given questions are communicated clearly, all of the time. • Conventions are used all of the time. • Layout is easy to follow, unique and creative. • Effectively connects global warming and natural disasters and applies the effects to humans and the planet, with a high degree of effectiveness. Assignment is handed in on time. Name: __________________________________ (M) Infographic Geography What is the purpose of an infographic? It is a visual image such as a chart or diagram used to represent information or data. It uses a combination of visuals (charts, pictures, graphs, etc) and words to make information engaging and easy to understand. See some examples at: http://infographicality.com/ Task: Design an infographic that addresses the following questions: 1. Is global warming increasing natural disasters? 2. Why or how is this bad for humans or the planet? Choose 1 natural disaster to focus. Use your notes from class and added research to create the best infographic you can. Be specific – use real-life examples and logical thinking is a must (science and geography beats out the movies!). You may choose to focus on one or two natural disasters or look at many. Planning and pre-thinking of layout versus amount of information will be crucial! Creation: You have two options 1. You can draw and build your infographic on paper. 2. You can use Piktochart.com. Piktochart.com 1. Note: this site works best in Google Chrome 2. You will need to create an account so that your work can be saved and accessed online from school or home. 3. Choose a template (there are MANY to choose from) but choose one that fits with the theme of the assignment. 4. Once complete you will save the infographic as a “jpeg” (aka an image) file and submit it electronically through StudentConnect on the school laptops. Due date: _________________________________________________ You will be given _______ weeks (aka _________ 40min periods) to complete this assignment – it is EXPECTED that you are putting in some time outside of class as well. The classroom is available most recesses as a work space. Natural Disaster Info Sheet (M) Geological Geological Atmospheric Type Natural Disaster Earthquakes Volcanoes Hurricanes Atmospheric Ice Storms Hydrological/Geological Connection Atmospheric Tsunamis Hydrological Floods Tornadoes Connected to Temperature Increases? No No Yes Fuelled by warm ocean waters Tropical Winds (warm air) Yes More interaction between cold and warm air masses No Yes More interaction between cold and warm air masses Hotter air means increased chances of tornado formation or stronger tornadoes Yes Meltwater Connection to other natural disasters – hurricanes, etc. The natural disaster I am going to focus on is:___________________________________________________ Why would global warming increase this natural disaster? How is this going to affect humans? How is this going to affect the planet? I need three visuals (picture or graph): 1. 2. 3.
