fec12047-sup-0002-TableS1-S4-FigureS1-S5
advertisement

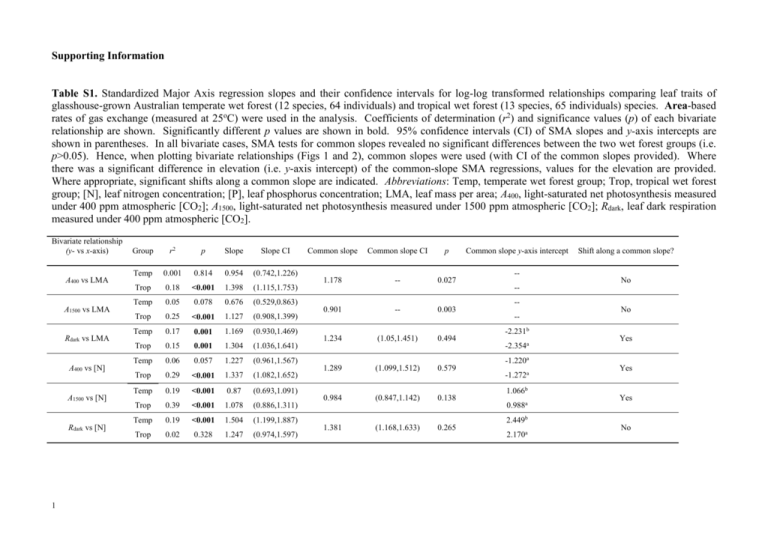
Supporting Information Table S1. Standardized Major Axis regression slopes and their confidence intervals for log-log transformed relationships comparing leaf traits of glasshouse-grown Australian temperate wet forest (12 species, 64 individuals) and tropical wet forest (13 species, 65 individuals) species. Area-based rates of gas exchange (measured at 25oC) were used in the analysis. Coefficients of determination (r2) and significance values (p) of each bivariate relationship are shown. Significantly different p values are shown in bold. 95% confidence intervals (CI) of SMA slopes and y-axis intercepts are shown in parentheses. In all bivariate cases, SMA tests for common slopes revealed no significant differences between the two wet forest groups (i.e. p>0.05). Hence, when plotting bivariate relationships (Figs 1 and 2), common slopes were used (with CI of the common slopes provided). Where there was a significant difference in elevation (i.e. y-axis intercept) of the common-slope SMA regressions, values for the elevation are provided. Where appropriate, significant shifts along a common slope are indicated. Abbreviations: Temp, temperate wet forest group; Trop, tropical wet forest group; [N], leaf nitrogen concentration; [P], leaf phosphorus concentration; LMA, leaf mass per area; A400, light-saturated net photosynthesis measured under 400 ppm atmospheric [CO2]; A1500, light-saturated net photosynthesis measured under 1500 ppm atmospheric [CO2]; Rdark, leaf dark respiration measured under 400 ppm atmospheric [CO2]. Bivariate relationship (y- vs x-axis) A400 vs LMA A1500 vs LMA Rdark vs LMA A400 vs [N] A1500 vs [N] Rdark vs [N] 1 Group r2 p Slope Slope CI Temp 0.001 0.814 0.954 (0.742,1.226) Trop 0.18 <0.001 1.398 (1.115,1.753) Temp 0.05 0.078 0.676 (0.529,0.863) Trop 0.25 <0.001 1.127 (0.908,1.399) Temp 0.17 0.001 1.169 (0.930,1.469) Trop 0.15 0.001 1.304 (1.036,1.641) Temp 0.06 0.057 1.227 (0.961,1.567) Trop 0.29 <0.001 1.337 (1.082,1.652) Temp 0.19 <0.001 0.87 (0.693,1.091) Trop 0.39 <0.001 1.078 (0.886,1.311) Temp 0.19 <0.001 1.504 (1.199,1.887) 0.328 1.247 Trop 0.02 (0.974,1.597) Common slope Common slope CI p 1.178 -- 0.027 0.901 -- 0.003 1.234 (1.05,1.451) 0.494 1.289 (1.099,1.512) 0.579 0.984 (0.847,1.142) 0.138 1.381 (1.168,1.633) 0.265 Common slope y-axis intercept -----2.231b -2.354a Shift along a common slope? No No Yes -1.220a -1.272a 1.066b 0.988a Yes Yes 2.449b 2.170a No Table S2. Pearson correlation values (top right hand corner of table) for bivariate trait relationships from A-Ci curve fitting results (see main text for species used), irrespective of environmental origin of species. Leaf traits were log10 -transformed before analysis. Abbreviations: LMA, leaf dry mass per unit leaf area; [N], mass-based nitrogen concentration (% dry mass); Vcmax, carboxylation capacity; Jmax, photosynthetic electron transport capacity; LMA [N] Jmax/Vcmax Vcmax 2 [N] -0.71*** Jmax/Vcmax Vcmax Jmax 0.37** -0.59*** -0.57*** -0.31** 0.55*** 0.52*** -0.48** 0.18ns 0.94*** Table S3. Standardized Major Axis regression slopes and their confidence intervals for log-log transformed relationships comparing leaf traits of glasshouse-grown Australian temperate wet forest (12 species, 64 individuals) and tropical wet forest (13 species, 65 individuals) species. Analysis undertaken using species means of mass based data; for comparable analysis using individual plant replicate data, see Table 3 in the main text. Dry mass-based rates of gas exchange (measured at 25oC) were used in the analysis. Coefficients of determination (r2) and significance values (p) of each bivariate relationship are shown. Significantly different p values are shown in bold. 95% confidence intervals (CI) of SMA slopes and y-axis intercepts are shown in parentheses. In all bivariate cases, SMA tests for common slopes revealed no significant differences between the two wet forest groups (i.e. p>0.05). Hence, when plotting bivariate relationships (Figs 1 and 2), common slopes were used (with CI of the common slopes provided). Where there was a significant difference in intercept of the common-slope SMA regressions, values for the y-axis intercept (intercept) are provided. Where appropriate, significant shifts along a common slope are indicated. Abbreviations: Temp, temperate wet forest group; Trop, tropical wet forest group; [N], leaf nitrogen concentration; [P], leaf phosphorus concentration; LMA, leaf mass per area; Asat, light-saturated net photosynthesis measured under 400 ppm atmospheric [CO2]; A1500, light-saturated net photosynthesis measured under 1500 ppm atmospheric [CO2]; Rdark, leaf dark respiration measured under 400 ppm atmospheric [CO2]. Bivariate relationship (y- vs x-axis) [N] vs LMA A400 vs LMA A1500 vs LMA Rdark vs LMA A400 vs [N] A1500 vs [N] Rdark vs [N] 3 Group r2 p Slope Slope CI Temp Trop Temp Trop Temp Trop Temp Trop Temp Trop Temp Trop Temp 0.408 0.172 0.548 0.108 0.646 0.204 0.141 0.157 0.507 0.392 0.643 0.656 0.297 0.025 0.158 0.006 0.273 0.002 0.121 0.229 0.180 0.009 0.022 0.002 0.001 0.067 -0.750 -0.931 -1.334 -1.088 -1.013 -0.837 -0.865 -0.754 1.777 1.168 1.349 0.899 1.153 (-1.26,-0.447) (-1.65,-0.526) (-2.107,-0.844) (-1.965,-0.602) (-1.522,-0.674) (-1.468,-0.477) (-1.599,-0.469) (-1.343,-0.424) (1.104,2.862) (0.711,1.92) (0.896,2.033) (0.615,1.314) (0.658,2.021) Trop 0.056 0.437 -0.810 (-1.486,-0.442) Common slope y- Intercept Common slope Common slope CI p 2.904 -0.825 (-0.567,-1.211) 0.577 1.641 -1.241 (-0.862,-1.763) 0.588 1.4707 -0.952 (-0.682,-1.309) 0.584 -0.1022 -0.805 (-0.532,-1.217) 0.727 -3.521 1.46 (1.016,2.073) 0.216 no no -2.448 1.086 (0.803,1.467) 0.136 no no -3.4517 0.985 (0.647,1.480) 0.397 no no axis intercept 3.045a 2.926b 1.465a 1.284b 1.355a 1.157b -0.217a -0.400b Shift along a common slope? no no no no Table S4. Standardized Major Axis regression slopes and their confidence intervals for log-log transformed relationships comparing leaf traits of glasshouse-grown Australian temperate wet forest (10 species, 52 individuals) and tropical wet forest (11 species, 55 individuals) angiosperm species. Dry mass-based rates of gas exchange (measured at 25oC) were used in the analysis. Coefficients of determination (r2) and significance values (p) of each bivariate relationship are shown. Significantly different p values are shown in bold. 95% confidence intervals (CI) of SMA slopes and y-axis intercepts are shown in parentheses. In all bivariate cases, SMA tests for common slopes revealed no significant differences between the two wet forest groups (i.e. p>0.05). Hence, when plotting bivariate relationships (Figs 1 and 2), common slopes were used (with CI of the common slopes provided). Where there was a significant difference in elevation (i.e. y-axis intercept) of the common-slope SMA regressions, values for the elevation are provided. Where appropriate, significant shifts along a common slope are indicated. Abbreviations: Temp, temperate wet forest group; Trop, tropical wet forest group; [N], leaf nitrogen concentration; [P], leaf phosphorus concentration; LMA, leaf mass per area; A400, light-saturated net photosynthesis measured under 400 ppm atmospheric [CO2]; A1500, light-saturated net photosynthesis measured under 1500 ppm atmospheric [CO2]; Rdark, leaf dark respiration measured under 400 ppm atmospheric [CO2]. Bivariate relationship (y- vs x-axis) [N] vs. LMA A400 vs. LMA A1500 vs. LMA Rdark vs. LMA A400 vs. [N] A1500 Vs. [N] Rdark vs. [N] 4 Group r2 p Slope Slope CI Temp Trop Temp Trop Temp Trop Temp Trop Temp Trop Temp Trop Temp 0.294 0.070 0.324 0.052 0.494 0.138 0.235 0.108 0.260 0.175 0.401 0.325 0.263 0.004 <0.001 0.05 <0.001 0.095 <0.001 0.005 <0.001 0.014 <0.001 0.001 <0.001 <0.001 <0.001 0.659 -0.813 -0.873 -1.455 -1.474 -1.147 -1.192 -1.395 -1.388 1.790 1.690 1.412 1.366 1.716 -1.590 (-1.03,-0.642) (-1.135,-0.671) (-1.834,-1.154) (-1.922,-1.131) (-1.403,-0.939) (-1.535,-0.926) (-1.784,-1.091) (-1.795,-1.073) (1.405,2.28) (1.319,2.165) (1.135,1.756) (1.092,1.71) (1.348,2.185) (-2.087,-1.212) Trop Common slope Common slope CI p -0.839 (-0.704,-1) 0.677 -1.463 (-1.23,-1.741) 0.948 -1.164 (-0.996,-1.362) 0.831 -1.391 (-1.165,-1.661) 0.971 1.741 (1.465,2.068) 0.736 1.390 (1.189,1.623) 0.830 1.660 (1.386,1.986) 0.673 Common slope yaxis intercept 3.034b 2.96a 1.671b 1.834a 1.714b 1.522a 0.771b 0.619a -3.453b -3.488a -2.5b -2.59a -4.263b -4.293a Shift along a common slope? no no yes no yes yes yes Figure S1. Australia-wide spatial distributions of each of the tropical and temperate wet-forest species used in our glasshouse study. Distributions show are mapped occurrence patterns obtained from the Atlas of Living Australia website (http://bie.ala.org.au/species/), with individual mapped occurrences shown as blue or orange data points on maps of Australia. Biome Species distribution Agathis robusta Cryptocarya laevigata Doryphora aromatica Dysoxylum papuanum Ficus destruens Ganophyllum falcatum Gomphandra australiana Prumnopitys ladei Synima cordierorum Syzygium kuranda Toona ciliata Wrightia laevis Acacia verticillata Acradenia frankliniae Anopterus glandulosus Aristotelia peduncularis Atherosperma moschatum Athrotaxis selaginoides Eucalyptus regnans Hedycarya angustifolia Lagarostrobos franklinii Nothofagus cunninghamii Tasmannia lanceolata Tropical Temperate Eucryphia lucida 5 Xanthophyllum octandrum Figure S2. Matrix showing distribution in relation to rainfall of the tropical and temperate wet-forest species used in our glasshouse study. Distribution values have been arranged in annual rainfall classes (in groups of 100 mm year -1), using mapped occurrence patterns and associated rainfall values from the Atlas of Living Australia website (http://bie.ala.org.au/) (dark blue indicates species presence; light blue indicates species absence). We acknowledge the generous help of Dr Adam Carroll (Division of Plant Sciences, ANU) in obtaining and processing of the rainfall distribution data. Biome Species Distribution across wet forest sites differing in rainfall (mm) 100-200 Agathis robusta Doryphora aromatica Dysoxylum pachyphyllum Ficus destruens Ganophyllum falcatum Tropical Gomphandra australiana Prumnopitys ladei Synima cordierorum Syzygium kuranda Toona ciliata Wrightia laevis Xanthophyllum octandrum Acacia verticillata Acradenia frankliniae Anopterus glandulosus Aristotelia peduncularis Atherosperma moschatum Temperate Athrotaxis selaginoides Eucalyptus regnans Eucryphia lucida Hedycarya angustifolia Lagarostrobos franklinii Nothofagus cunninghamii Tasmannia lanceolata 6 200-300 300-400 400-500 500-600 600-700 700-800 800-900 900-1000 1000-1100 1100-1200 1200-1300 1300-1400 1400-1500 1500-1600 1600-1700 1700-1800 1800-1900 1900-2000 >2000 Figure S3. An example curve fitting of the response of light-saturated CO2 assimilation rate, A (areabased) to intercellular CO2 (Ci) for a leaf from a temperate wet forest species (Eucalyptus regnans). Dashed line corresponds to Rubisco-limited rates (Ac) and the dotted line corresponds to RuBPregeneration limited rates (Aj) for an A-Ci curve. Vcmax and Jmax were calculated from curve fits using equations in the Materials and Methods. For this replicate, Vcmax (carboxylation capacity) and Jmax (photosynthetic electron transport capacity) values were 103.8 and 172.3 μmol m–2 s–1, respectively. 60 50 -2 -1 Anet (mol m s ) 70 40 30 20 10 Measured Modeled Ac 0 Modeled Aj 0 500 1000 1500 Ci (ppm) 7 2000 2500 Figure S4. Log-log plots of area-based leaf gas exchange rates in relation to leaf mass per unit leaf area (LMA) (A, C, E) and leaf [N] (B, D, F) for glasshouse-grown 12 temperate and 13 tropical wet forest species. (A) and (B) show rates of light-saturated photosynthesis measured at 400 ppm [CO2] (A400), while (C) and (D) show rates of light-saturated photosynthesis measured at 1500 ppm [CO2] (A1500). (E) and (F) show rates of leaf respiration measured in darkness (Rdark). Data points represent individual plant values (temperate, 64 individuals; tropical, 65 individuals). Standardized Major Axis (SMA) tests for common slopes revealed no significant difference when comparing temperate and tropical species, but with the elevation (i.e. y-axis intercept) of the bivariate relationship being higher in temperate species when plotted against LMA (Table 2); no difference in elevation was found when plotted against leaf [N]. Symbols: closed symbols, temperate species; open symbols, tropical species. SMA regressions: solid line, temperate species; dashed line, tropical species; dotted line, both temperate and tropical species combined (B) (A) 30 -2 -1 A400 (umol m s ) Temperate Tropical 10 3 (C) (D) (E) (F) -2 -1 A1500 (umol m s ) 1 100 30 10 -2 -1 Rdark (umol m s ) 3 10 3 1 .3 20 40 80 160 -2 LMA (g m ) 8 1 3 10 -2 Leaf [N] (g m ) Figure S5. Log-log plots of mass-based rates of light-saturated photosynthesis (A400) (A and B) and respiration in darkness (Rdark) (C and D) versus [N] and LMA. Values for our data from glasshousegrown temperate and tropical wet forest species are shown on top of GLOPNET leaf trait values (Wright et al. 2004). (A) (B) (C) (D) 2.5 -1 -1 A400 (nmol g s ) 3.0 2.0 1.5 1.0 1.5 -1 -1 Rdark (nmol g s ) 0.5 2.0 1.0 0.5 0.0 1.0 1.5 2.0 2.5 -2 LMA (g m ) 9 3.0-0.5 0.0 0.5 Leaf [N] (%) 1.0


