TI-84+ Graphing: Find Max/Min
advertisement
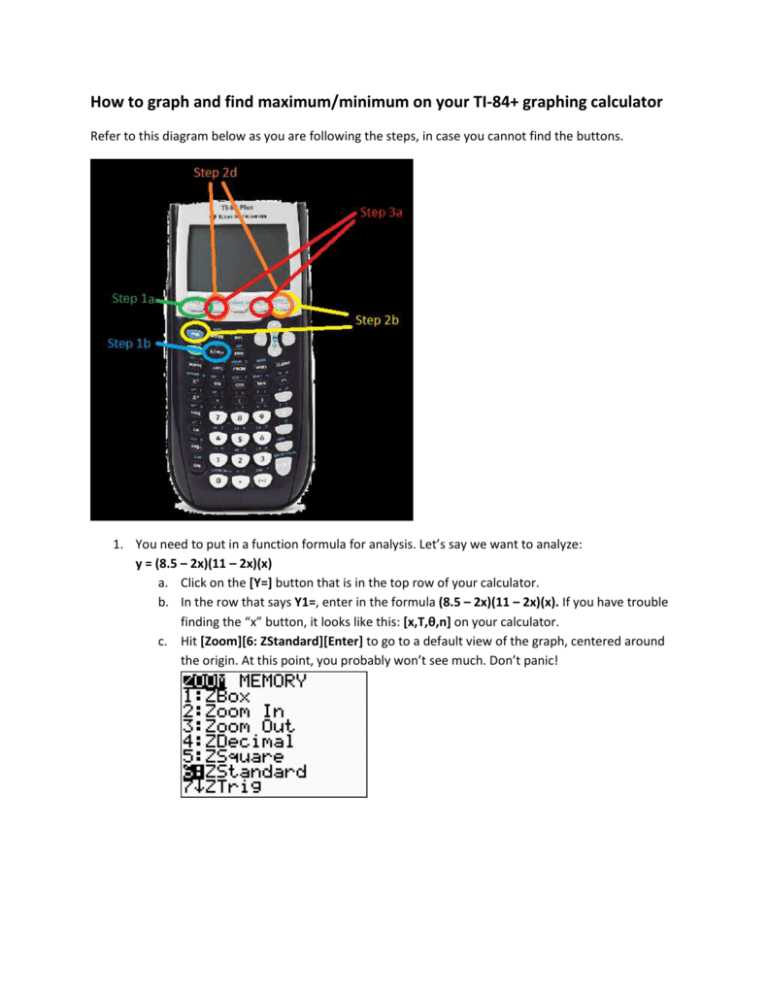
How to graph and find maximum/minimum on your TI-84+ graphing calculator Refer to this diagram below as you are following the steps, in case you cannot find the buttons. 1. You need to put in a function formula for analysis. Let’s say we want to analyze: y = (8.5 – 2x)(11 – 2x)(x) a. Click on the [Y=] button that is in the top row of your calculator. b. In the row that says Y1=, enter in the formula (8.5 – 2x)(11 – 2x)(x). If you have trouble finding the “x” button, it looks like this: [x,T,θ,n] on your calculator. c. Hit [Zoom][6: ZStandard][Enter] to go to a default view of the graph, centered around the origin. At this point, you probably won’t see much. Don’t panic! 2. Now that we have entered our equation successfully into the calculator, we will need to adjust the zoom in order to see our desired maximum point. a. Since this is a problem that we have already analyzed before, you will hopefully remember that we want to adjust the domain to be 0 < x < 4.25. In our graphing calculator, these boundaries are called XMin and XMax. (XMin stands for “X minimum”, which means the smallest X that we want to see. XMax stands for “X maximum”, which means the biggest X that we want to see.) In this case, I will want to adjust my window to go from XMin=0, to XMax=4.25. Notice that XMax must always be bigger than XMin. b. But, before we adjust the XMin and XMax, it might be helpful for me to also know how high I want to make my window, so that I can actually see the maximum point. Here, the Pro Tip is to take a quick peek at your function’s points, to get a sense of where they are located and how high they will go. Where can we do that on the graphing calculator? You can do so under [2nd][Table]. Scroll to take a look at your Y-values, particularly those between X=0 and X=4.25. How high do the Y-values seem to go within our domain? c. It looks to me like your maximum height (maximum Y-value) will be somewhere between 60 and 70. So, we will want to make YMax=70, and YMin=0. These values will control the vertical boundaries of our viewing window. d. Go to [Window] and change XMin=0, XMax=4.25, YMin=0, YMax=70, and hit [Graph] again to see the now changed graph. Before you move on, please make sure you understand how I decided on those 4 values!! What does each of them mean? e. Now, you should see a graph that mirrors this graph in Desmos. Congratulations! You just learned how to adjust the window on your graphing calculator! You are well on your way to being a graphing calculator ninja. 3. Now, we will look for the Maximum point on our graph. Before you do this, you should know that it’s a bit more complicated on the graphing calculator than in Desmos. The way the graphing calculator “finds” a maximum is by testing a bunch of X-values against your formula, and whichever one returns the highest Y-Value, is the one that it will return as the maximum. So, in order to do this, your calculator will ask you to specify a range of X-Values to test. (It will ask, “Left bound?” meaning “Give me a point that is definitely to the left of the desired maximum.” And then, it will ask, “Right bound?” meaning “Give me a point that is definitely to the right of the desired maximum.” And then it will ask, “Guess?” which means “Can you give me a guess for what the X-value of the maximum might be?” You don’t really have to guess. Anyhow, after the three questions, it will return the maximum point to you. a. To find the maximum, go to [2nd][Calculate][Maximum] b. Move your blinking cursor with the left arrow, until you are comfortably to the left of the peak. Then, hit [Enter] to confirm that this is your “left bound.” c. Move your cursor with the right arrow, until you are comfortably to the right of the peak. Then, hit [Enter] to confirm that this is your “right bound.” d. Now, when asked for a Guess, I usually just hit [Enter] again to bypass the guess. If you are feeling ambitious, you could move towards the actual maximum and hit [Enter]. This might save the graphing calculator a fraction of a second in guessing X-values. e. When the calculator stops calculating, it should return Maximum at the bottom of the screen. Here is an example of what it might look like, on a different function. In this case, your maximum that is returned should be at roughly (1.585, 66.15). Did you get it? Hurray if yes! If not, ask your teacher or a colleague for help!


