Square Roots
advertisement
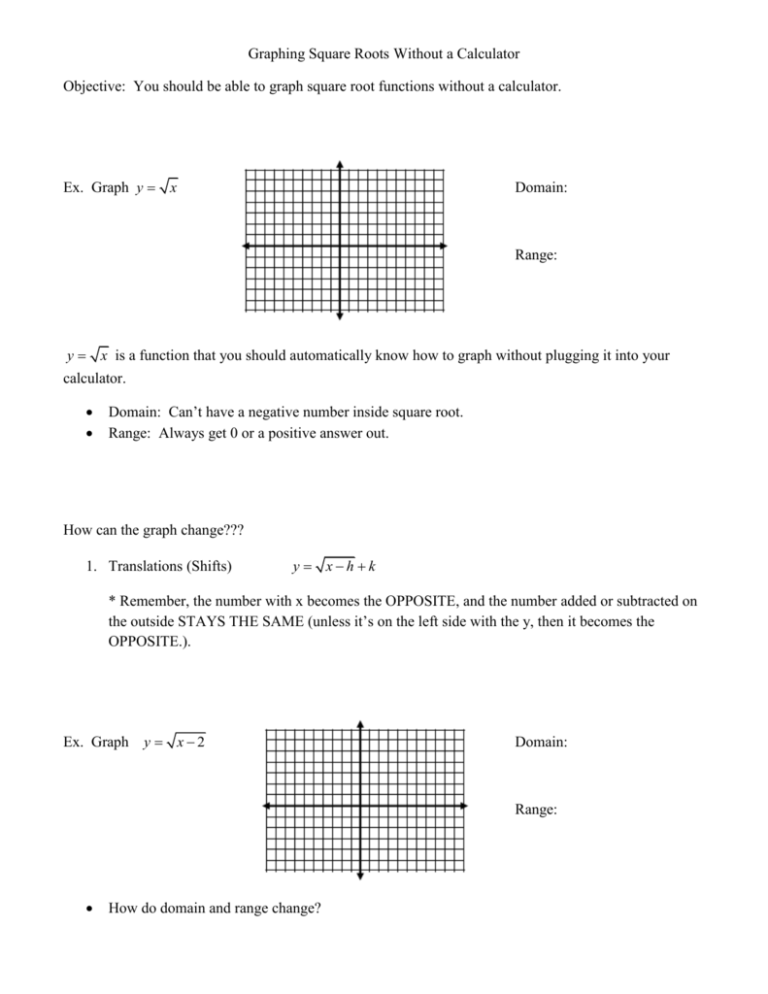
Graphing Square Roots Without a Calculator Objective: You should be able to graph square root functions without a calculator. Ex. Graph y x Domain: Range: y x is a function that you should automatically know how to graph without plugging it into your calculator. Domain: Can’t have a negative number inside square root. Range: Always get 0 or a positive answer out. How can the graph change??? 1. Translations (Shifts) y xh k * Remember, the number with x becomes the OPPOSITE, and the number added or subtracted on the outside STAYS THE SAME (unless it’s on the left side with the y, then it becomes the OPPOSITE.). Ex. Graph y x 2 Domain: Range: How do domain and range change? Ex. Graph y x 4 Domain: Range: How do domain and range change? Ex. Graph y x3 2 Domain: Range: How do domain and range change? 2. Reflections y x - Changes the Y-values to OPPOSITE, so reflects over X-AXIS. y x - Changes the X-values to OPPOSITE, so reflects over Y-AXIS. Ex. Graph y x Domain: Range: How do the domain and range change? Ex. Graph y x Domain: Range: How do the domain and range change? 3. Stretching and Shrinking Graphs Vertically and Horizontally yc x - Changes the WHOLE function, so multiplying Y-value by c. y cx - Changes the X-value, so multiplying the X-value by the RECIPROCAL of c. Ex. Graph y2 x Domain: Range: How do the domain and range change? Ex. Graph y 2x Domain: Range: How do the domain and range change? Now let’s graph with multiple changes: Ex. Graph y 2 x3 Domain: Range: How do the domain and range change? Ex. Graph y x 3 Domain: Range: How do the domain and range change? Ex. Graph y x 1 2 Domain: Range: How do the domain and range change? Ex. Write the equation of the graph given. Ex. Write the equation of the graph given. Ex. Write the equation of the graph given.
