Supplementary material
advertisement

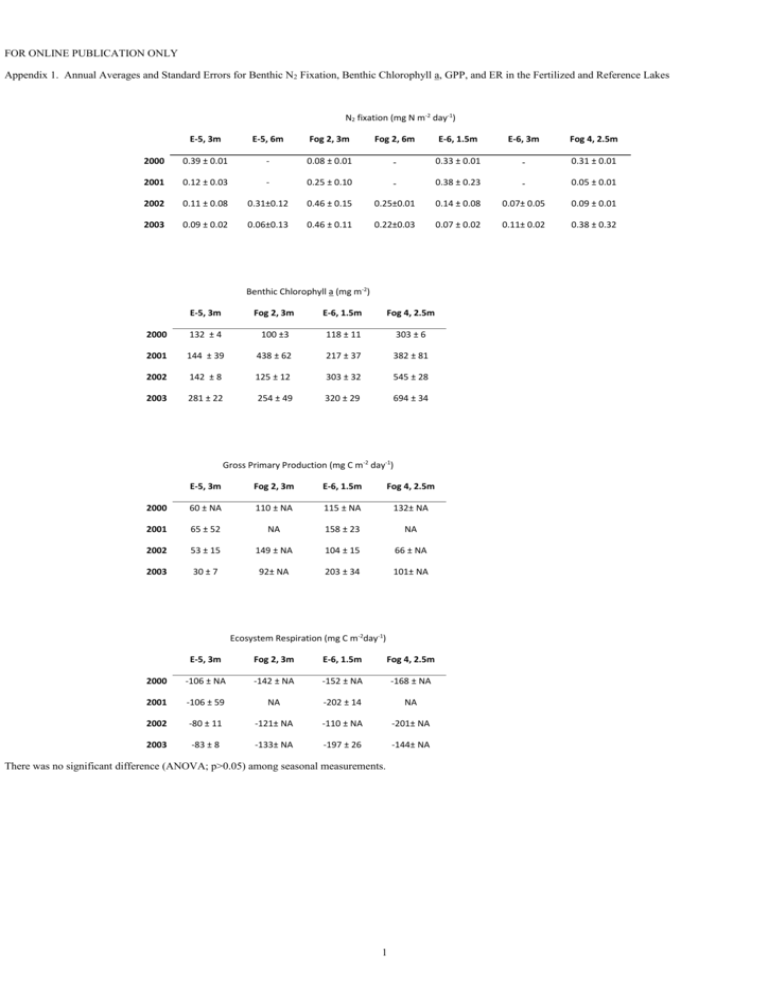
FOR ONLINE PUBLICATION ONLY Appendix 1. Annual Averages and Standard Errors for Benthic N2 Fixation, Benthic Chlorophyll a, GPP, and ER in the Fertilized and Reference Lakes N2 fixation (mg N m-2 day-1) E-5, 3m E-5, 6m Fog 2, 3m Fog 2, 6m E-6, 1.5m E-6, 3m Fog 4, 2.5m 2000 0.39 ± 0.01 - 0.08 ± 0.01 - 0.33 ± 0.01 - 0.31 ± 0.01 2001 0.12 ± 0.03 - 0.25 ± 0.10 - 0.38 ± 0.23 - 0.05 ± 0.01 2002 0.11 ± 0.08 0.31±0.12 0.46 ± 0.15 0.25±0.01 0.14 ± 0.08 0.07± 0.05 0.09 ± 0.01 2003 0.09 ± 0.02 0.06±0.13 0.46 ± 0.11 0.22±0.03 0.07 ± 0.02 0.11± 0.02 0.38 ± 0.32 Benthic Chlorophyll a (mg m-2) E-5, 3m Fog 2, 3m E-6, 1.5m Fog 4, 2.5m 2000 132 ± 4 100 ±3 118 ± 11 303 ± 6 2001 144 ± 39 438 ± 62 217 ± 37 382 ± 81 2002 142 ± 8 125 ± 12 303 ± 32 545 ± 28 2003 281 ± 22 254 ± 49 320 ± 29 694 ± 34 Gross Primary Production (mg C m-2 day-1) E-5, 3m Fog 2, 3m E-6, 1.5m Fog 4, 2.5m 2000 60 ± NA 110 ± NA 115 ± NA 132± NA 2001 65 ± 52 NA 158 ± 23 NA 2002 53 ± 15 149 ± NA 104 ± 15 66 ± NA 2003 30 ± 7 92± NA 203 ± 34 101± NA Ecosystem Respiration (mg C m-2day-1) E-5, 3m Fog 2, 3m E-6, 1.5m Fog 4, 2.5m 2000 -106 ± NA -142 ± NA -152 ± NA -168 ± NA 2001 -106 ± 59 NA -202 ± 14 NA 2002 -80 ± 11 -121± NA -110 ± NA -201± NA 2003 -83 ± 8 -133± NA -197 ± 26 -144± NA There was no significant difference (ANOVA; p>0.05) among seasonal measurements. 1 Appendix 2. Summary of Repeated Measures ANOVA Models for Benthic Processes in the Fertilized and Reference Lakes Numerator DF Denominator DF Treatment 1 41 3.05 0.039 Year 3 41 16.91 0.0002 Lake (Deep vs. Shallow) 1 23 39.19 <0.0001 Lake 1 23 11.51 0.003 Treatment 1 33 42.25 <0.0001 Year 3 33 22.81 <0.0001 Lake (Deep vs. Shallow) 1 33 8.92 0.005 F-Value p-value N2 Fixation (mg N2 fixed m-2 day-1) Gross Primary Production (mg C m-2 day-1) Community Respiration (mg C m-2 day-1) Benthic Chlorophyll a/Total Chlorophyll The most parsimonious model was determined by using the maximum likelihood test and resulted in models that included only significant predictors of the Y variable, which did not include significant interaction terms. 2 Appendix 3. Magnitude of Significant Effects for Repeated Measures ANOVAs for Benthic Processes in Fertilized and Reference Lakes Estimate Standard Error DF TValue p-value N2 Fixation (mg N2 fixed m2 day-1) Treatment Fertilized 0.083 0.020 41 4.11 . Reference 0.317 0.057 41 4.11 0.0002 2000 0.222 0.079 41 2.81 0.008 2001 0.048 0.036 41 1.36 0.182 2002 0.007 0.032 41 0.22 0.830 2003 0.083 0.020 41 4.11 Deep 49.040 11.190 23 -6.26 Shallow 119.090 8.330 23 14.30 Deep -92.700 15.877 23 3.39 Shallow -146.560 9.433 23 3.39 . Fertilized 0.683 0.026 33 26.16 . Reference 0.857 0.027 33 6.50 <0.0001 2000 0.373 0.044 33 -7.02 <0.0001 2001 0.515 0.028 33 -6.01 <0.0001 2002 0.567 0.031 33 -3.72 0.0007 2003 0.683 0.026 33 26.16 . Deep 0.613 0.023 33 -2.99 Shallow 0.683 0.026 33 26.16 Year . GPP (mg C m-2 day-1) Lake <0.0001 . CR (mg C m-2 day-1) Lake Sampling Depth 0.001 Benthic Chlorophyll a/Total Chlorophyll Treatment Year Lake 0.005 . Dummy variables are denoted by a period and are used to determine which variables are significantly different from one another by the corresponding p-value. 3 Appendix 4. Results from Randomized Coefficent Analysis Relating N2 Fixation Rates to Ambient Light in the Fertilized and Reference Lakes for All Years Estimate Standard Error Intercept -0.073 Log Light (E m-2 sec-1) 0.057 Slope DF TValue p-value 0.07 156 -1.04 0.300 0.021 156 2.74 0.007 DF TValue p-value Standard Error E5 0.0004 0.0005 156 0.81 0.420 E6 -0.0003 0.0003 156 -0.90 0.370 Fog 2 0.0010 0.0004 156 2.79 0.006 Fog 4 0.0001 0.0006 156 0.16 0.870 Lake Fog 2 was responsible for the overall light effect. 4 Appendix 5. ANOVA Statistics for the Nutrient Core Incubation Experiment DF Mean Square Error F-Value p-value Treatment 3 0.015 4.29 0.04 Error 8 0.003 Total 11 0.61 0.62 0.44 0.74 1.159 0.43 Benthic N2-fixation Chlorophyll a Treatment 3 1273 Error 16 2079 Total 19 Gross Primary Production Treatment 3 7313 Error 4 16754 Total 7 Respiration Treatment 3 1804 Error 4 1556 Total 7 There was a significant treatment effect for benthic N2 fixation and for the ending N:P ratio molar concentrations. Treatment was not significant for chlorophyll a, gross primary production, or respiration. 5


