Statistics Example: Batterer Treatment Program Analysis
advertisement
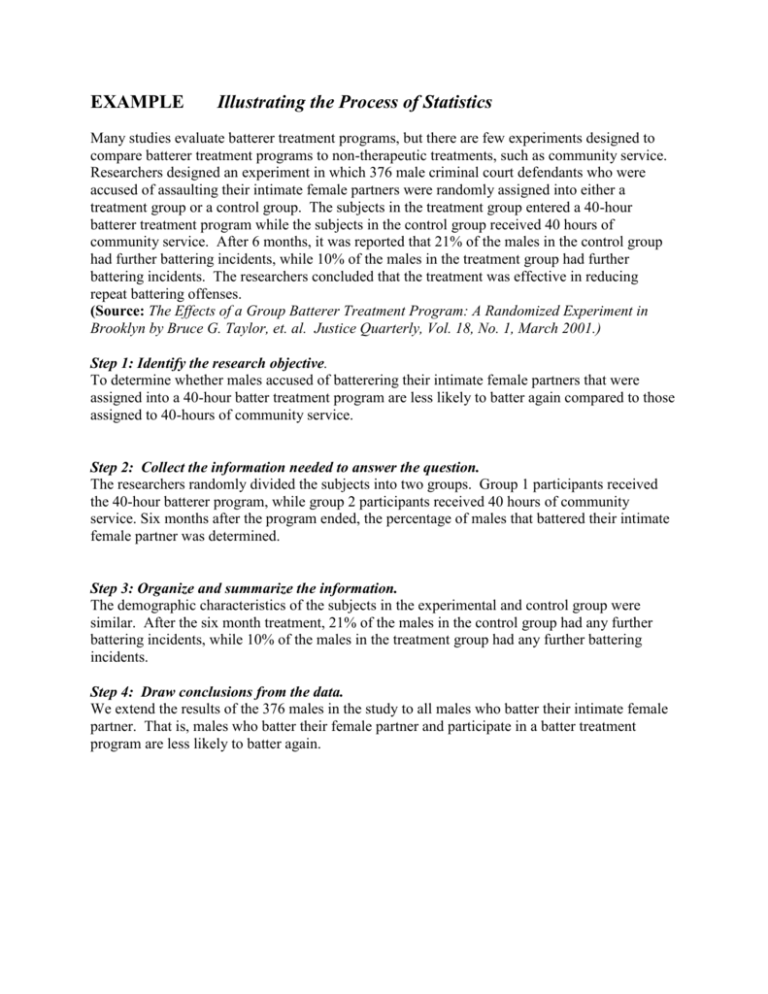
EXAMPLE Illustrating the Process of Statistics Many studies evaluate batterer treatment programs, but there are few experiments designed to compare batterer treatment programs to non-therapeutic treatments, such as community service. Researchers designed an experiment in which 376 male criminal court defendants who were accused of assaulting their intimate female partners were randomly assigned into either a treatment group or a control group. The subjects in the treatment group entered a 40-hour batterer treatment program while the subjects in the control group received 40 hours of community service. After 6 months, it was reported that 21% of the males in the control group had further battering incidents, while 10% of the males in the treatment group had further battering incidents. The researchers concluded that the treatment was effective in reducing repeat battering offenses. (Source: The Effects of a Group Batterer Treatment Program: A Randomized Experiment in Brooklyn by Bruce G. Taylor, et. al. Justice Quarterly, Vol. 18, No. 1, March 2001.) Step 1: Identify the research objective. To determine whether males accused of batterering their intimate female partners that were assigned into a 40-hour batter treatment program are less likely to batter again compared to those assigned to 40-hours of community service. Step 2: Collect the information needed to answer the question. The researchers randomly divided the subjects into two groups. Group 1 participants received the 40-hour batterer program, while group 2 participants received 40 hours of community service. Six months after the program ended, the percentage of males that battered their intimate female partner was determined. Step 3: Organize and summarize the information. The demographic characteristics of the subjects in the experimental and control group were similar. After the six month treatment, 21% of the males in the control group had any further battering incidents, while 10% of the males in the treatment group had any further battering incidents. Step 4: Draw conclusions from the data. We extend the results of the 376 males in the study to all males who batter their intimate female partner. That is, males who batter their female partner and participate in a batter treatment program are less likely to batter again. Example 1 According to Variety (Aug. 27, 2009), the average age of viewers of live television programs broadcast on CBS, NBC, and ABC is 51 years. Suppose a rival network (e.g. Fox) executive hypothesizes that the average age of Fox viewers is less than 51. To test her hypotheses, she samples 200 Fox viewers and determines the age of each. a. Describe the population. The population is the set of units of interest to the TV executive, which is the set of all Fox Viewers. b. Describe the variable of interest. The age (in years) of each viewer is the variable of interest. c. Describe the sample. The sample must be a subset of the population. In this case, it is the 200 Fox viewers selected by the executive. d. Describe the inference. The inference of interest involves the generalization of the information contained in the sample of 200 viewers to the population of all Fox viewers. In particular, the executive wants to estimate the average age of the viewers in order to determine whether it is less than 51 years. Example 2 “Cola Wars” is the popular term for intense competition between Coca-Cola and Pepsi displayed in their marketing campaigns, which have featured movie and television stars, rock videos, athletic endorsements, and claims of consumer preference based on taste tests. Suppose, as part of a Pepsi marketing campaign, 1,000 cola consumers are given a blind taste test (i.e., a taste test in which the two brand names are disguised). Each consumer is asked to state a preference for Brand A or brand B. a. Describe the population. Since we are interested in the responses of cola consumers in taste test, a cola consumer is the experimental unit. Thus, the population of interest is the collection or set of all cola consumers. b. Describe the variable of interest. The characteristic that Pepsi wants to measure is the consumer’s cola preference, as revealed under the conditions of blind taste test, so cola preference is the variable of interest. c. Describe the sample. The sample is 1,000 cola consumers selected from the population of all cola consumers. d. Describe the inference. The inference of interest is the generalization of the cola preferences of the 1,000 sampled consumers to the population of all cola consumers. In particular, the preferences of the consumers in the sample can be used to estimate the percentages of cola consumers who prefer each brand.
