Area-Effects-Worksheet
advertisement
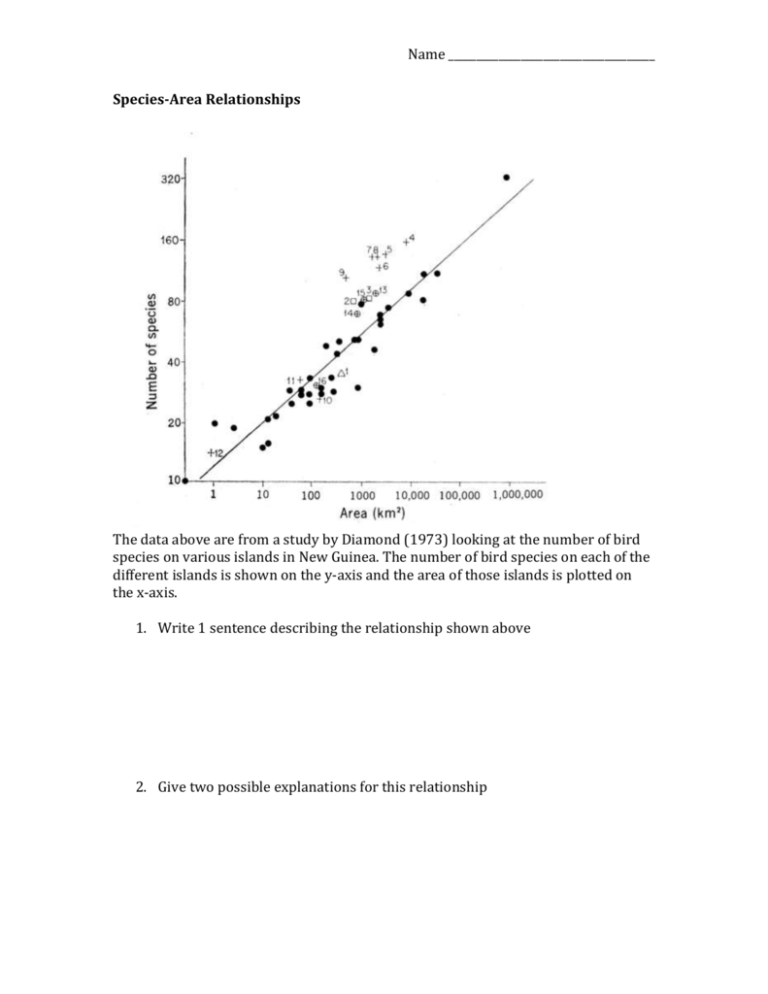
Name _____________________________________ Species-Area Relationships The data above are from a study by Diamond (1973) looking at the number of bird species on various islands in New Guinea. The number of bird species on each of the different islands is shown on the y-axis and the area of those islands is plotted on the x-axis. 1. Write 1 sentence describing the relationship shown above 2. Give two possible explanations for this relationship Newmark (1995) looked at extinction rates of mammals among 14 North American national parks. The data are shown at right. Based on this relationship, circle the park on the diagram at right for which rates of extinction are lowest. Why do you think this is? How might mammals be more prone to extinction than other types of organisms (like insects for example)? Describe a possible solution for decreasing extinction rates in these National Parks. Suppose you were given enough money to conserve 10,000 hectares of land. Would you rather buy one large 10,000 hectare piece of property or 10 pieces of property that were 1,000 hectares each? Which solution might be best for conserving the greatest number of species? Why? What other characteristics might you take into consideration when planning your reserve?

