Probability and Statistics Chapter 2 Section 2.1 Frequency
advertisement
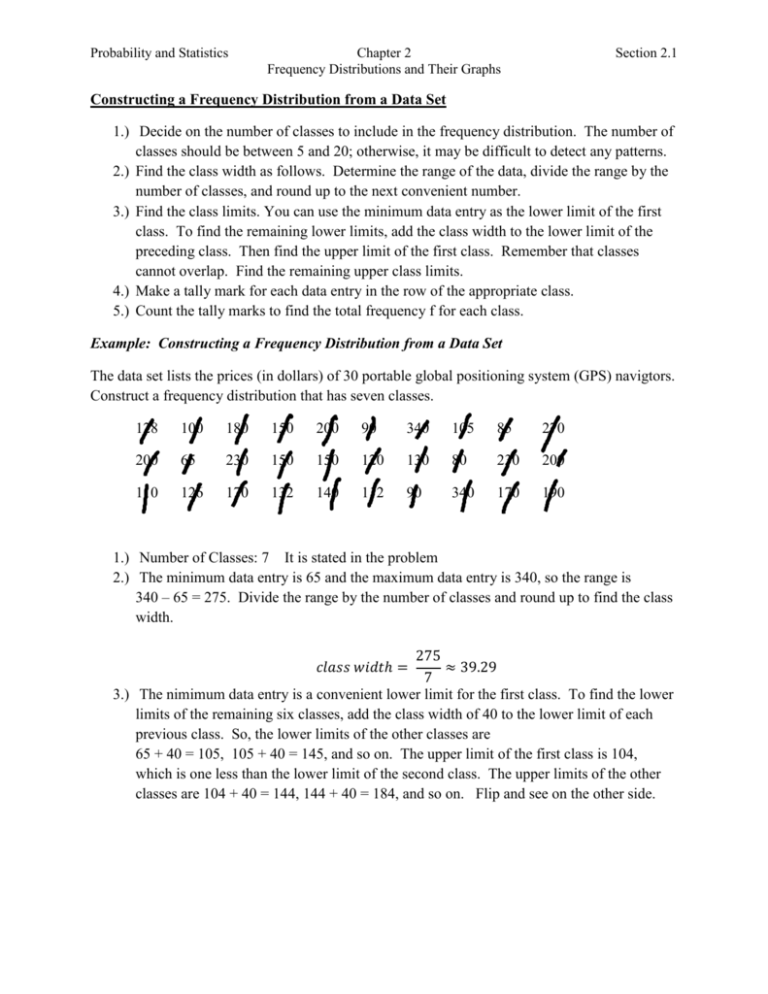
Probability and Statistics Chapter 2 Frequency Distributions and Their Graphs Section 2.1 Constructing a Frequency Distribution from a Data Set 1.) Decide on the number of classes to include in the frequency distribution. The number of classes should be between 5 and 20; otherwise, it may be difficult to detect any patterns. 2.) Find the class width as follows. Determine the range of the data, divide the range by the number of classes, and round up to the next convenient number. 3.) Find the class limits. You can use the minimum data entry as the lower limit of the first class. To find the remaining lower limits, add the class width to the lower limit of the preceding class. Then find the upper limit of the first class. Remember that classes cannot overlap. Find the remaining upper class limits. 4.) Make a tally mark for each data entry in the row of the appropriate class. 5.) Count the tally marks to find the total frequency f for each class. Example: Constructing a Frequency Distribution from a Data Set The data set lists the prices (in dollars) of 30 portable global positioning system (GPS) navigtors. Construct a frequency distribution that has seven classes. 128 100 180 150 200 90 340 105 85 270 200 65 230 150 150 120 130 80 230 200 110 126 170 132 140 112 90 340 170 190 1.) Number of Classes: 7 It is stated in the problem 2.) The minimum data entry is 65 and the maximum data entry is 340, so the range is 340 – 65 = 275. Divide the range by the number of classes and round up to find the class width. 275 ≈ 39.29 7 3.) The nimimum data entry is a convenient lower limit for the first class. To find the lower limits of the remaining six classes, add the class width of 40 to the lower limit of each previous class. So, the lower limits of the other classes are 65 + 40 = 105, 105 + 40 = 145, and so on. The upper limit of the first class is 104, which is one less than the lower limit of the second class. The upper limits of the other classes are 104 + 40 = 144, 144 + 40 = 184, and so on. Flip and see on the other side. 𝑐𝑙𝑎𝑠𝑠 𝑤𝑖𝑑𝑡ℎ = Lower Limit 65 105 145 185 225 265 305 Upper Limit 104 144 184 224 264 304 344 4.) Make a tally mark for each data entry in the appropriate class. For instance, the data entry 128 is in the 105 – 144 class, so make a tally mark in that class. Continue until you have made a tally mark for each of the 30 data entries. 5.) The number of tally marks for a class is the frequency of that class. The first class, 65 – 104, has six tally marks. So, the frequency of this class is 6. Notice that the sum of the frequencies is 30, which is the number of entries in the data set. Class 65 – 104 105 – 144 145 – 184 185 – 224 225 – 264 265 – 304 305 - 344 Tally lllll l lllll llll lllll l llll ll l ll Frequency 6 9 6 4 2 1 2 ∑ 𝑓 = 30 In Your Notebooks Construct a frequency distribution table using the ages of the 50 most powerful women. 1.) 2.) 3.) 4.) 5.) State the number of classes. Find the minimum and maximum data entries and the class width. Find the class limits. Tally the data entries. Write the frequency f of each class. Construct a frequency distribution table for the data set using the indicated number of classes. Political Blog Reading Times Number of classes: 5 Data set: Times (in minutes) spent reading a political blog in a day 7 30 39 39 7 16 13 35 15 9 12 25 15 8 8 22 6 0 5 2 29 18 0 2 11
