File - Ms. Williams - science 10
advertisement
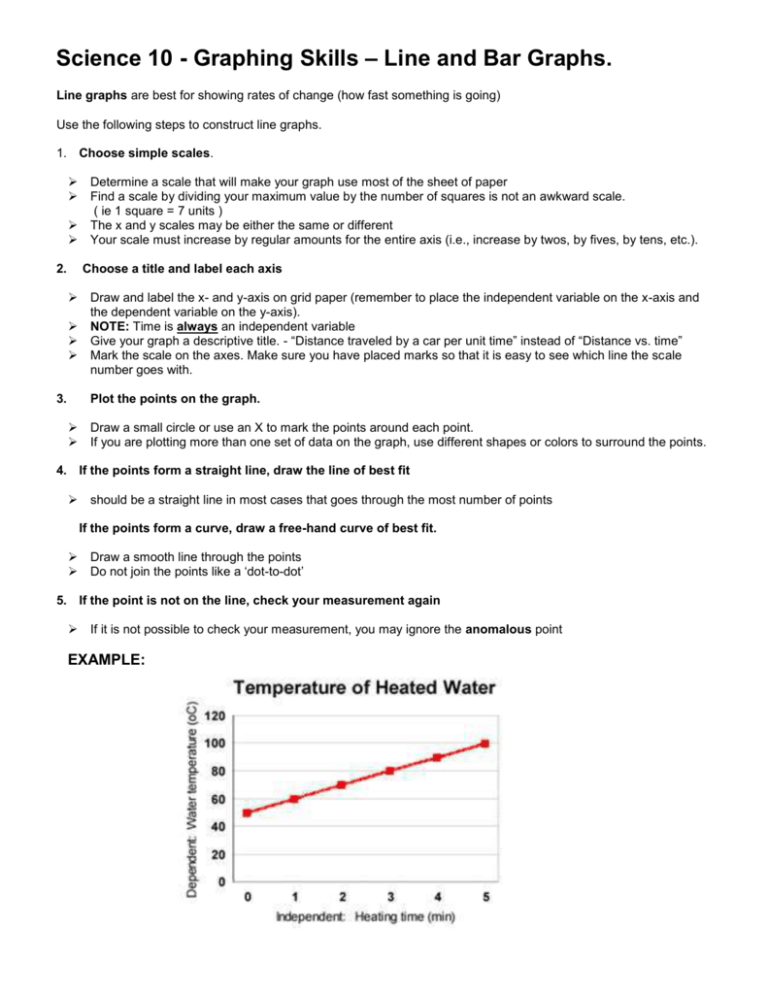
Science 10 - Graphing Skills – Line and Bar Graphs. Line graphs are best for showing rates of change (how fast something is going) Use the following steps to construct line graphs. 1. Choose simple scales. 2. Determine a scale that will make your graph use most of the sheet of paper Find a scale by dividing your maximum value by the number of squares is not an awkward scale. ( ie 1 square = 7 units ) The x and y scales may be either the same or different Your scale must increase by regular amounts for the entire axis (i.e., increase by twos, by fives, by tens, etc.). Choose a title and label each axis 3. Draw and label the x- and y-axis on grid paper (remember to place the independent variable on the x-axis and the dependent variable on the y-axis). NOTE: Time is always an independent variable Give your graph a descriptive title. - “Distance traveled by a car per unit time” instead of “Distance vs. time” Mark the scale on the axes. Make sure you have placed marks so that it is easy to see which line the scale number goes with. Plot the points on the graph. Draw a small circle or use an X to mark the points around each point. If you are plotting more than one set of data on the graph, use different shapes or colors to surround the points. 4. If the points form a straight line, draw the line of best fit should be a straight line in most cases that goes through the most number of points If the points form a curve, draw a free-hand curve of best fit. Draw a smooth line through the points Do not join the points like a ‘dot-to-dot’ 5. If the point is not on the line, check your measurement again If it is not possible to check your measurement, you may ignore the anomalous point EXAMPLE: Bar graphs are best for showing amounts of something so that we can compare them. The independent variable must be fixed values Use the following steps to construct bar graphs. 1. Choose simple scales. Determine a scale that will make your graph use most of the sheet of paper Find a scale by dividing your maximum value by the number of squares is not an awkward scale. ( ie 1 square = 7 units ) The x and y scales may be either the same or different Your scale must increase by regular amounts for the entire axis (i.e., increase by twos, by fives, by tens, etc.). 2. Choose a title and label each axis Draw and label the x- and y-axis on grid paper (remember to place the independent variable on the x-axis and the dependent variable on the y-axis). Give your graph a descriptive title. - “Distance traveled by a car per unit time” instead of “Distance vs. time” Mark the scale on the axes. Make sure you have placed marks so that it is easy to see which line the scale number goes with. FOR THE X-AXIS make sure the things you are comparing are equally spaced. 3. Draw bars on the graph, and shade them in Use a ruler to make rectangles that are even in width EXAMPLE: ACTIVITY 1: NAME: ____________ PERIOD:___________ In this activity you are going to make a few observations and record the data in a table. Afterward you will be graphing the data on a double line graph. EXPERIMENT: How many times can you snap your fingers in 1 minute? 1) Decide who will be the SNAPPER 2) When the timer starts SNAPPER – Start snaps COUNTER – Count the number of snaps that the Snapper accomplishes When 10 seconds is called out write down the number of snaps - Repeat this for each time until 60 seconds is reached 3) Switch jobs and repeat the experiment. (you will need to fill in the title and columns of the second table). Table 1. ______________’s snaps Time (s) Table 2. # of finger snaps in time interval 0 10 20 30 40 50 60 Graph the data above using a double line graph on the paper provided. We use a double line graph because we are looking at how many snaps are created per unit time (the speed that the Snapper can snap). ALL GRAPHS MUST BE DONE IN PENCIL ACTIVITY 2: In this activity you are going to make a few observations and record the data in a table. Afterward you will be graphing the data on a bar graph. EXPERIMENT: How many numbers can you write in one minute? 1) In the blank space below, get ready to write down as many numbers (in order) as you can in 1 minute. 2) Wait for the timer, and when the clock starts, start writing the numbers as high as you can go. 3) Find out data from 5 other people and record Table 1. Person # of numbers Graph the data above using a bar graph on the paper provided. - We use a bar graph because we want to compare totals NOT look at the speed or rate of number writing.

