Ex Scientific Paper - GK12StudentResearchProject
advertisement
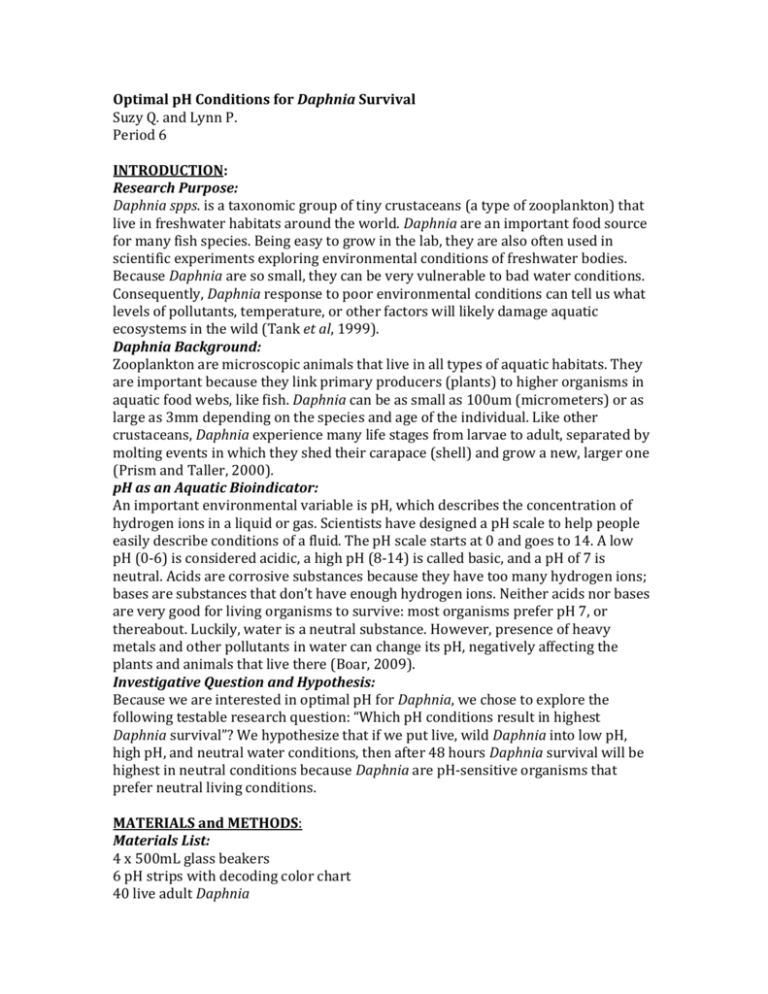
Optimal pH Conditions for Daphnia Survival Suzy Q. and Lynn P. Period 6 INTRODUCTION: Research Purpose: Daphnia spps. is a taxonomic group of tiny crustaceans (a type of zooplankton) that live in freshwater habitats around the world. Daphnia are an important food source for many fish species. Being easy to grow in the lab, they are also often used in scientific experiments exploring environmental conditions of freshwater bodies. Because Daphnia are so small, they can be very vulnerable to bad water conditions. Consequently, Daphnia response to poor environmental conditions can tell us what levels of pollutants, temperature, or other factors will likely damage aquatic ecosystems in the wild (Tank et al, 1999). Daphnia Background: Zooplankton are microscopic animals that live in all types of aquatic habitats. They are important because they link primary producers (plants) to higher organisms in aquatic food webs, like fish. Daphnia can be as small as 100um (micrometers) or as large as 3mm depending on the species and age of the individual. Like other crustaceans, Daphnia experience many life stages from larvae to adult, separated by molting events in which they shed their carapace (shell) and grow a new, larger one (Prism and Taller, 2000). pH as an Aquatic Bioindicator: An important environmental variable is pH, which describes the concentration of hydrogen ions in a liquid or gas. Scientists have designed a pH scale to help people easily describe conditions of a fluid. The pH scale starts at 0 and goes to 14. A low pH (0-6) is considered acidic, a high pH (8-14) is called basic, and a pH of 7 is neutral. Acids are corrosive substances because they have too many hydrogen ions; bases are substances that don’t have enough hydrogen ions. Neither acids nor bases are very good for living organisms to survive: most organisms prefer pH 7, or thereabout. Luckily, water is a neutral substance. However, presence of heavy metals and other pollutants in water can change its pH, negatively affecting the plants and animals that live there (Boar, 2009). Investigative Question and Hypothesis: Because we are interested in optimal pH for Daphnia, we chose to explore the following testable research question: “Which pH conditions result in highest Daphnia survival”? We hypothesize that if we put live, wild Daphnia into low pH, high pH, and neutral water conditions, then after 48 hours Daphnia survival will be highest in neutral conditions because Daphnia are pH-sensitive organisms that prefer neutral living conditions. MATERIALS and METHODS: Materials List: 4 x 500mL glass beakers 6 pH strips with decoding color chart 40 live adult Daphnia 100mL Vinegar (acid) 100mL Ammonia (base) 1L DI water (neutral) 400mL surface lake water Dissecting microscope with light source Petri dish Transfer Pipette Data Sheet Sharpie marker *Materials listed as amounts needed per trial Procedure: 1. Set up the four beakers on a well-lit windowsill. 2. Label the beakers with a sharpie as “Acidic”, “Basic”, “Neutral”, and “Control”. 3. Obtain the lake water and wild Daphnia collected by Miss Bowen from Lacamas Lake. 4. Fill the acid and base treatment beakers with 300mL of deionized water each. Fill the neutral beaker with 400mL DI water; fill the control beaker with 400mL lake water. 5. Add 100mL of vinegar to the acidic beaker; add 100mL of ammonia to the basic beaker. 6. To determine the pH of the water in each beaker, dip a new strip of pH paper into the water and match the color of the wet end of the strip with the color chart that came with the strips. 7. Record the corresponding starting pH of the water in each of the beakers. 8. Under the dissecting scope, double check that all Daphnia are alive and separate them into groups of 10 individuals. Transfer 10 Daphnia into each beaker. 9. Record what time the Daphnia were placed into each beaker; leave beakers undisturbed for 48 hours. 10. After 48 hours, use the pH paper to determine the ending pH of the water in each of the beakers. 11. Transfer Daphnia from one beaker at a time to the petri dish; under the microscope, observe how many from each beaker are still alive. 12. In your data table, record how many Daphnia from each beaker survived. 13. Repeat entire investigation two times to verify results. Data Analysis: We called the number of Daphnia still alive after 48 hours (ending Daphnia count) ‘survival counts’ in the data analysis. ‘Mortality’, or number of Daphnia that died within each beaker, was calculated as starting count minus survival count. Since the starting count was 10 Daphnia for each beaker, survival plus mortality should always equal 10 within individual beakers. We used Microsoft Office Excel 2010 to organize data and create all relevant bar charts. RESULTS: Ending Daphnia counts (survival) within treatment groups were variable and differences between trials ranged from 1 to 2 individuals only (Figure 1). Survival was highest in the Control group across all three trials (Figure 1). However, average Daphnia survival was the same between the Neutral and Control treatments (Figure 2). Survival counts were consistently lowest in the Acidic treatment throughout the trials, resulting in highest average mortality in that treatment group (Figures 1 and 2). Differences between starting and ending pH of each beaker across treatments ranged from 0-1 (data not included). However, on average there was no change in pH across the 48 hours within treatment groups (Table 1). DISCUSSION: Daphnia Survival: Because survival was highest in the Neutral and Control groups, our data seem to indicate that Daphnia prefer the neutral and control (near neutral) conditions (Figure 2). It is interesting to note that the Control group water conditions averaged a pH of 6, which is slightly acidic, yet survival was lowest in the Acidic treatment group (Figure 2). Also, survival was higher in the Basic than the Acidic treatment, which implies that our Daphnia were more sensitive to acidic conditions than to basic. This seeming sensitivity to acidic conditions could have serious consequences for the zooplankton community in the slightly acidic conditions of Lacamas Lake, which is known to be highly polluted (The Seattle Times, c1997). pH Conditions: Though there was slight variation in pH across trials for the Neutral and Control groups, there was no difference between average pH for these groups. This means that differences in pH between the Neutral and Control groups were likely insignificant. However, an average survival difference of three individuals between the Acidic and Basic groups and the Basic and Neutral groups suggests that our treatment groups were significantly different and that our results make a relevant statement (Figure 2). Sources of Error: Firstly, it is possible that not all the Daphnia we used were adults because of error during sorting under the microscope. Using Daphnia in different life stages could result in different levels of tolerances to stress (like pH change) and therefore survival counts that shouldn’t be compared. Similarly, it is possible that male verses female Daphnia respond differently to stressors; we did not include gender in our analysis. Lastly, using a color chart to decode pH readings could create conflicting data records due to the subjective interpretation of colors. However, we accounted for this by designating one researcher as the pH scale reader and the other as the data recorder. CONCLUSION: Near-neutral pH conditions resulted in the highest average Daphnia survival. The lowest average Daphnia survival count was 2 (out of 10) individuals in the Acidic treatment group. The Neutral and Control groups tied for the highest average survival count of 8 adult Daphnia (again, out of 10). Near-neutral conditions resulted in survival counts that were higher than Acidic conditions by 6 Daphnia. Because near-neutral conditions produced higher survival counts, we conclude that near-neutral pH water conditions are optimal for Daphnia survival. ACKNOWLEDGEMENTS: We’d like to thank Washington State University in Vancouver for the use of one of their dissecting microscopes as well as Miss Bowen for collecting and sorting zooplankton from Lacamas Lake for our project. FIGURES and TABLES: Daphnia Count Daphnia Survival After 48h 10 9 8 7 6 5 4 3 2 1 0 Trial 1 Trial 2 Trial 3 Acidic Basic Neutral Treatment Group Control Figure 1: Survival counts for Daphnia across all three trials of four treatment groups. The Control beaker consistently had highest survival counts; the Acidic treatment group experienced lowest survival counts across all trials. Average Change in Daphnia Counts After 48h Daphnia Count 10 8 6 Survival 4 Mortality 2 0 Acidic Basic Neutral Treatment Groups Control Figure 2: Average survival and mortality of Daphnia in each treatment group after 48 hours. Because all Daphnia that lived + all Daphnia that died = 10 in each treatment group, survival count + mortality count = 10 within each treatment. Average Daphnia survival was equal and highest in the Neutral and Control groups; average survival was lowest (average mortality was highest) in the Acidic treatment group. Treatment Average Group pH Acidic 3 Basic 9 Neutral 7 Control 6 Table 1: Average pH values across all three trials for each treatment group. The difference between the starting and ending pH was minimal in all cases (difference range: 0-1). REFERENCES: Boar, Robert E. (2009) Environmental indicators of aquatic pollution. Limnology and Marine Studies 4(8):134-152. Tank, Todd, Raine, Margaret, Strut, Theodore, Graves, Lawrence, and Friedman, Leonard (1999) Using Daphnia in experimental research. Research in Limnology 8(2):45-98. Prism, Petunia C. and William A. Taller (2000) Life cycle of Daphnia spps. in temperate freshwater systems. Journal of Plankton Research 3:1245-1276. The Seattle Times (c1997) Officials Seek Solution To Lacams Lake Pollution. http://community.seattletimes.nwsource.com/archive/?date=19970706&slug=254 8101


