Zebra mussels & the food web - Cary Institute of Ecosystem Studies
advertisement
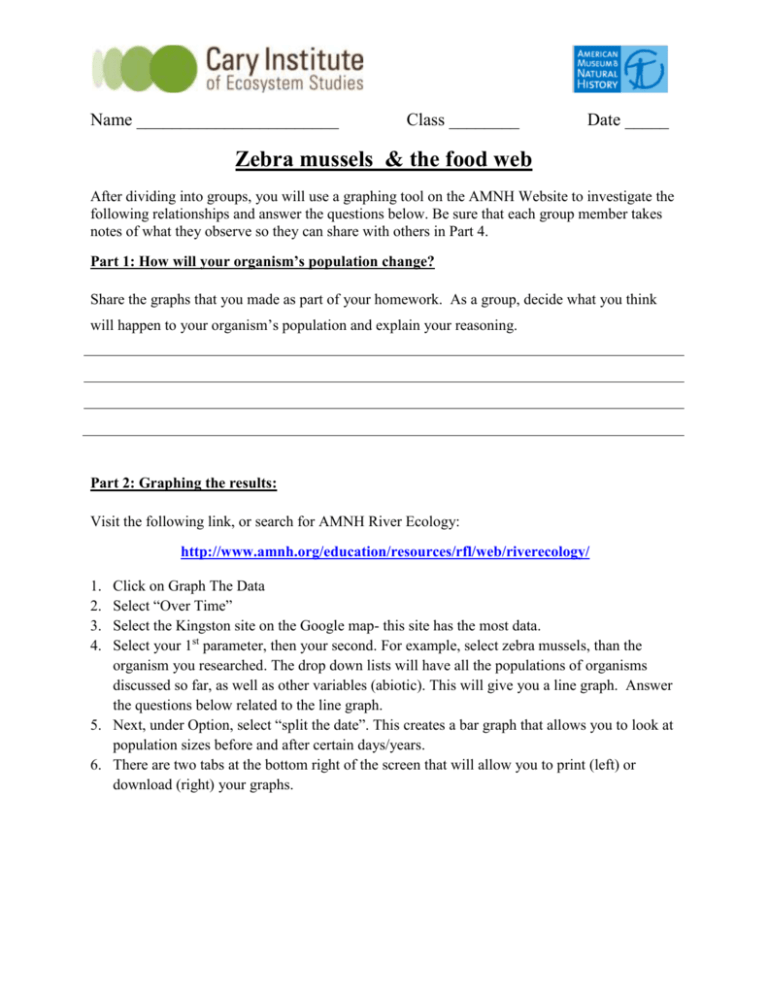
Name _______________________ Class ________ Date _____ Zebra mussels & the food web After dividing into groups, you will use a graphing tool on the AMNH Website to investigate the following relationships and answer the questions below. Be sure that each group member takes notes of what they observe so they can share with others in Part 4. Part 1: How will your organism’s population change? Share the graphs that you made as part of your homework. As a group, decide what you think will happen to your organism’s population and explain your reasoning. Part 2: Graphing the results: Visit the following link, or search for AMNH River Ecology: http://www.amnh.org/education/resources/rfl/web/riverecology/ 1. 2. 3. 4. Click on Graph The Data Select “Over Time” Select the Kingston site on the Google map- this site has the most data. Select your 1st parameter, then your second. For example, select zebra mussels, than the organism you researched. The drop down lists will have all the populations of organisms discussed so far, as well as other variables (abiotic). This will give you a line graph. Answer the questions below related to the line graph. 5. Next, under Option, select “split the date”. This creates a bar graph that allows you to look at population sizes before and after certain days/years. 6. There are two tabs at the bottom right of the screen that will allow you to print (left) or download (right) your graphs. Part 3 – Summarizing results: Your Organism: ___________________________________ Your Group Partners:____________________________________________________________ 1) Was the claim that you made in Part 1 supported by the results from the line graph? Why or why not? 2) Are there other trends or patterns in your graph that you didn’t anticipate? What might explain these trends? 3) Does the bar graph support the claim you made in Part 1? Why or why not? 4) Compare and contrast the two graphs you created using the graphing tool (line graph vs. split date bar graph). Benefits of the line graph: Benefits of the bar graph: Drawbacks of the line graph: Drawbacks of the bar graph: 5) Using what you have learned, make a claim, supported by evidence and explained through reasoning, about how your organism’s population was affected by zebra mussels. The scientific question is: How was your organism affected by the zebra mussel invasion? Claim (A scientific claim is an answer to the scientific question) Evidence (Data and observations that support the claim) Reasoning (Reasoning describes how science connects the evidence to the claim) 6) Is there enough evidence to support your claim? What else would you like to know in order to be more confident? (For example, do you need more data? Has the study been conducted over a long enough time period?) ________________________________________________________________________ ________________________________________________________________________ ________________________________________________________________________ Part 4: Sharing Results Split up so that you are in a group with other students who each studied a different organism. Fill in the following chart as a group to summarize the trends in relationships between these organisms and zebra mussels. Organism Change: Increase? Decrease? No change? Unionidae (freshwater pearly mussels) Sphaeriidae (fingernail clams) Centrachidae ( fish in vegetated shallows e.g. sunfish, pumpkinseed) Alosa (open water fish, e.g. shad) Phytoplankton/ Chlorophyll A Copepods (zooplankton) Copepod nauplii (larval stage of zooplankton) Bacterial Abundance (decomposers) Rotifers (Zooplankton) Cladocera (zooplankton) Make Another Prediction: What other effects might zebra mussels have on the environment, besides animal and plant life? Think of abiotic (non-living) factors that may be affected by zebra mussels. ____________________________________________________________________________ ____________________________________________________________________________
