mec12217-sup-0003-TableS1-S5-FigS1-S3
advertisement
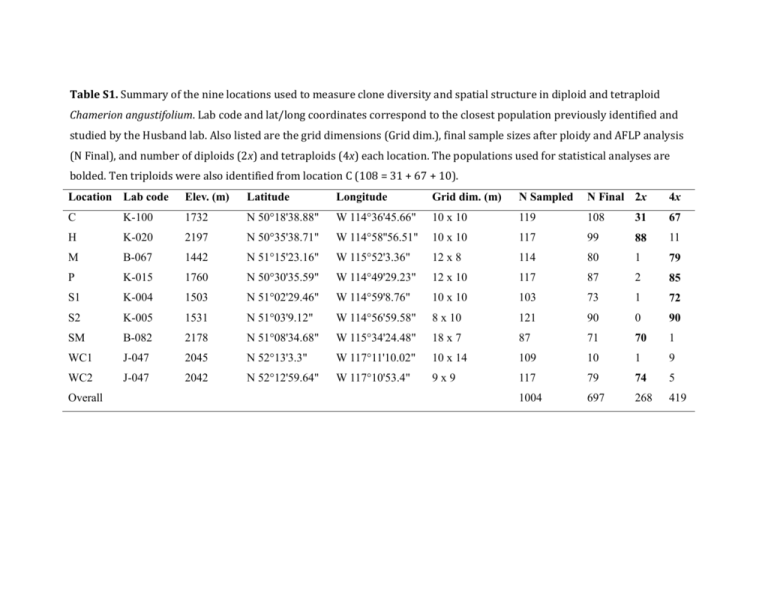
Table S1. Summary of the nine locations used to measure clone diversity and spatial structure in diploid and tetraploid Chamerion angustifolium. Lab code and lat/long coordinates correspond to the closest population previously identified and studied by the Husband lab. Also listed are the grid dimensions (Grid dim.), final sample sizes after ploidy and AFLP analysis (N Final), and number of diploids (2x) and tetraploids (4x) each location. The populations used for statistical analyses are bolded. Ten triploids were also identified from location C (108 = 31 + 67 + 10). Location Lab code Elev. (m) Latitude Longitude Grid dim. (m) N Sampled N Final 2x 4x C K-100 1732 N 50°18'38.88" W 114°36'45.66" 10 x 10 119 108 31 67 H K-020 2197 N 50°35'38.71" W 114°58''56.51" 10 x 10 117 99 88 11 M B-067 1442 N 51°15'23.16" W 115°52'3.36" 12 x 8 114 80 1 79 P K-015 1760 N 50°30'35.59" W 114°49'29.23" 12 x 10 117 87 2 85 S1 K-004 1503 N 51°02'29.46" W 114°59'8.76" 10 x 10 103 73 1 72 S2 K-005 1531 N 51°03'9.12" W 114°56'59.58" 8 x 10 121 90 0 90 SM B-082 2178 N 51°08'34.68" W 115°34'24.48" 18 x 7 87 71 70 1 WC1 J-047 2045 N 52°13'3.3" W 117°11'10.02" 10 x 14 109 10 1 9 WC2 J-047 2042 N 52°12'59.64" W 117°10'53.4" 9x9 117 79 74 5 1004 697 268 419 Overall Table S2. The number of plant samples, number of AFLP fragments, frequency of fragments, and repeatability of fragments. Values are given for each fluorescently labeled primer pair used: MseI-CAG with EcoRI-ACG (blue), MseI-CAG with EcoRI-ACA (green), and MseI-CGA with EcoRI-AAG (yellow). Primer pair Blue Green Yellow Overall Number of plant samples 766 880 948 697 Number of fragments 144 136 153 433 Frequency of fragments 0.0721 0.0452 0.0849 0.0696 Repeatability of fragments 0.9802 0.9763 0.9608 0.9721 Table S3. Summary of locations, sample sizes, and ploidy frequencies for seed sources used to test the effect of ploidy on root bud production in Chamerion angustifolium in a greenhouse study. Initial sample sizes are the number of plants and maternal seed families initially germinated and transplanted. The final sample size includes only families and plants that survived to the end of the study and that were also successfully screened for ploidy. Initial sample size Final sample size Ploidy freq. Lab code Elevation (m) Latitude Longitude Families Plants Families Plants 2x 4x J-077 1768 N 52°48'6.00'' W 118°04'57.36'' 32 51 16 26 25 1 K-038 2010 N 50°49'32.04'' W 115°12'3.12'' 25 51 21 38 31 7 B-060 2090 N 51°27'15.54'' W 116°08'36.30'' 12 20 4 11 0 11 WY-093 2110 N 44°23'57.07'' W 104°57'14.86'' 10 25 8 20 0 20 K-003 1365 N 51°03'21.00'' W 115°00'50.16'' 16 46 15 39 4 35 97 193 64 134 60 74 Total Table S4. Clone diversity and extent of clonality in four diploid and five tetraploid populations of Chamerion angustifolium. Genotype number is the number of distinct AFLP clones (G). The “percentage of genotypes that are clonal” is the proportion of genotypes that are assigned to more than one ramet. The “percentage of ramets in the largest genotype” is the proportion of ramets in the genotype with the most ramets. Diploid populations Tetraploid populations Location code C H SM WC2 C M P S1 S2 Ramet number (N) 31 88 70 74 67 79 85 72 90 Genotype number (G) 10 5 6 3 14 11 8 13 8 Effective genotype number (Ge) 4.23 1.62 3.61 1.25 5.30 1.66 1.50 3.23 3.35 Genotypic richness (G-1) / (N-1) 0.30 0.05 0.07 0.03 0.20 0.13 0.08 0.17 0.08 Ramets per genotype (N/G) 3.10 17.60 11.67 24.67 4.79 7.18 10.63 5.54 11.25 Ramets per effective genotype (N/Ge) 7.32 54.42 19.40 59.29 12.64 47.73 56.70 22.30 26.89 Percentage of genotypes that are clonal 40.0 60.0 100.0 100.0 57.1 36.4 50.0 46.2 75.0 Percentage of ramets in the largest genotype 38.7 77.3 38.6 89.2 32.8 77.2 81.2 52.8 44.4 Clonal diversity Clone size Table S5. Moran’s I values of spatial autocorrelation for AFLP genotypes at each of eight distance classes and correlogram slopes for nine populations of diploid (2x) and tetraploid (4x) Chamerion angustifolium. Moran’s I values that are significantly greater than zero are shaded in dark grey and values significantly less than zero are shaded light grey. Asterisks indicate significance level (P <0.05*, <0.01**, <0.001***). Distance interval (maximum) Location Ploidy 1.4 2.8 4.2 5.7 7.1 8.5 9.9 13.0 Slope C 2x 0.127 0.082 0.016 -0.099 -0.109 -0.157* -0.047 0.127 -0.038** H 2x 0.186 * 0.110 0.116* 0.083 -0.047 -0.107 -0.154 -0.350 -0.048* SM 2x 0.519*** 0.409*** 0.178*** -0.007 -0.147*** -0.169*** -0.157** -0.211*** -0.049*** WC2 2x 0.627*** 0.123 -0.144 -0.309* 0.047 0.210* 0.173 -0.288 0.004 C 4x 0.083 -0.000 0.032 * -0.015 -0.043 -0.034 -0.061 -0.109 -0.014* M 4x 0.034 -0.036 0.015 -0.054 -0.062 -0.055 0.112 0.719** -0.012 P 4x 0.054 0.020 -0.088 -0.053 0.001 0.087 -0.083 0.034 0.006 S1 4x -0.030 -0.000 0.006 -0.019 0.029 -0.045 -0.011 -0.090 0.006 S2 4x 0.537*** 0.467*** 0.209*** -0.050 -0.248*** -0.312*** -0.391*** -0.385*** -0.118*** 80 70 Sample count 60 50 40 30 20 10 0 50 60 70 80 90 100 110 120 130 140 FL2 – Area (relative fluorescence) 150 160 170 Fig S1. Distribution of relative fluorescence values for all samples analyzed via flow cytometry. The distributions of diploid (first peak) and tetraploid (last peak) Chamerion angustifolium are distinct from each other. Diploid and tetraploid values are also distinct from the distribution of the standard, Solanum lycopersicum, and the nine triploids identified (middle peak). Samples within 10% of means for 2x, 3x and 4x were automatically classified as such (shaded regions). Samples that deviate by more than 10% were assigned to the nearest ploidy (illustrated by arrows). 220 Number of pairwise comparisons 165 C 110 H SM WC2 55 0 0 5 10 15 20 25 30 35 40 45 50 Number of differences between AFLP genotypes 55 60 65 70 220 Number of pairwise comparisons 165 C PJ 110 S1 S2 M 55 0 0 5 10 15 20 25 30 35 40 45 50 Number of differences between AFLP genotypes 55 60 65 70 Fig S2. Pairwise distance distribution of AFLP genotypes for the A) four diploid populations and B) five tetraploid populations. The first major valley (highlighted by red circles) in each the pairwise distance distribution for each population (excluding the tetraploid populations M and S1, which did not have a well defined valley) was averaged across all populations to determine the overall threshold for clone identification (18 differences, indicated by the red lines). A) ! ! " " & & ! " " & & & ! ( ! # ! ' & ! & # ! ! # & " ! & * # # ! ! ! ' # ( ! ! ' # $ # ) & # ) " # * ! ! ! ! !! ! # !% ! # $ ' ! !" ! !& " !& !! ! " " & ! " !! " !! # ( ) !% ! !! " ! !# ! " ! & ! ( ! ! " " ! " ' ! ! ) " " ) B) ! ! ! % ! ! ! ! ! ! ! % ! " ! ! ! ! ! % ! ! ! ! ! ! ! % % " ! ! ! ! ! % ! ! ! ! ! ! ! ! ! ! ! ! ! ! " ! ! ! ! ! ! ! ! " % ! ! ! ! ! # ! ! ! ! % ! ! ! ! % ! ! ! ! $ ! ! " ! ! " " ! ! $ " " " % ! ! ! C) " " " " " " ! % " " " " " " " " " " " " " " " " " ! " " " " ! " " " " ' " " " " " " " " " " ( & " " " " " " " * # " " & " & ) $ & " " " " # " & " " " " % " " "' " ( " " ( " " " " " " " " " "" & " " " D) ! " $ " " " " " " ! ! " " " " " " " " & " " " " " " " " ! " " " " " ' " " " " " " " " " " " ( " " " & & & " " " " " " " " ! & " " " " $ E) ! ! # ! " " " " " " " # $ " " " % " !& " " ! " " ' ( ) " * " " ' " $ !! $ " # " ( " # ( ( " ! " " $ $ " $ " " " !# " " " " " # $ ' ! # " ' " " " !" # F) ! ! ! ! ! ! $ $ $ ' ( ! ! ! ! ! ! ! ! ! $ $ $ $ $ $ $ $ $ ' $ ! ! ! ! ! $ $ $ $ " $ ! ! $ ! ! $ $ $ $ $ " " ! $ $ % $ $ $ $ $ $ " $ $ " " " # # # $ $ $ $ $ " " # # # % % & $ " " " G) ! ! ! # ! ! ! # ! # ! ! ! # # ! " " # ! ! ! " ! ! ! " ! " ! ! " ! ! ! ! ! # # # # # # # $ % ! # # # # # $ # % ! # # & ! & & & & & & & & & & & H) ! ! ! ! ! ! ! ! ! ! ! ! ! ! ! ! ! ! ! ! ! ! ! ! ! ! ! ! ! ! ! ! ! " " ! ! ! " ! ! " ! ! ! ! ! ! ! ! ! ! ! ! ! ! ! ! ! ! ! ! ! ! ! ! ! ! ! ! ! ! ! ! ! ! ! ! ! Fig S3. Spatial distribution of ALFP genotypes and ploidy for individual Chamerion angustifolium plants sampled along grids with 1 meter intervals at eight locations: A) C Coleman Clear-Cut, B) H - Highwood Pass, C) M - Moose Meadows, D) P - Pickel Jar, E) S1 - Sibbald Road 1, F) S2 - Sibbald Road 2, G) SM - Sulphur Mountain, and H) WC2 - Wilcox Creek 2. At each location, numbers indicate samples assigned to the same genotype. Diploids are shown with black squares, triploids with purple squares and tetraploids with pink squares. 15
