Electronic Supplementary Material Table S1 Parent colony
advertisement
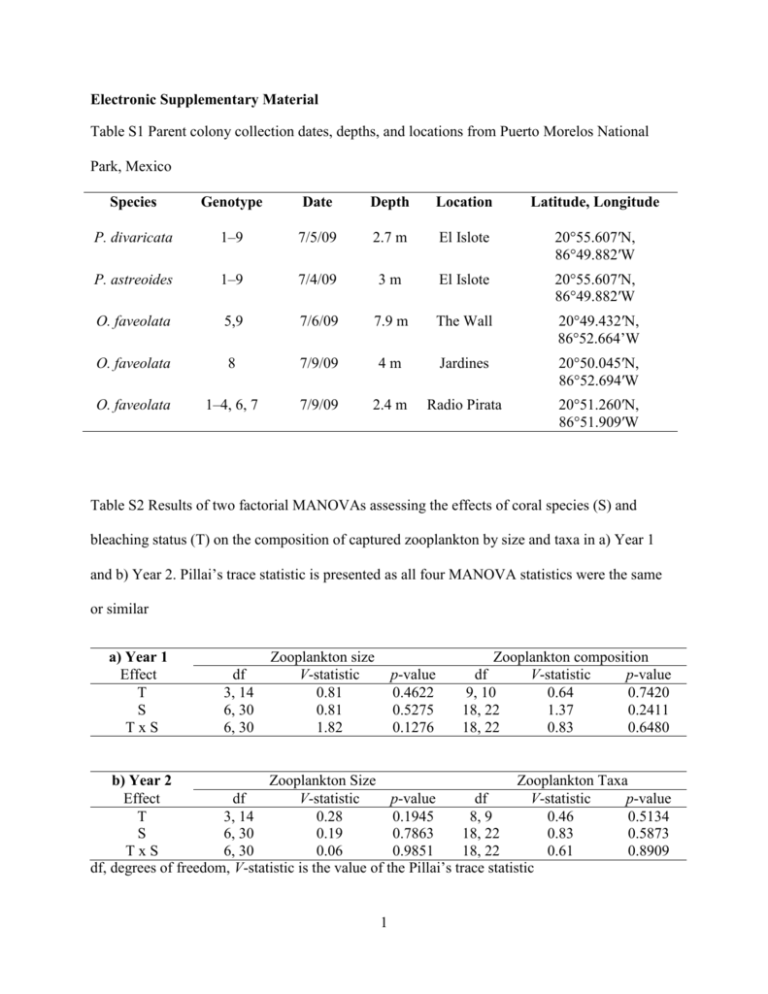
Electronic Supplementary Material Table S1 Parent colony collection dates, depths, and locations from Puerto Morelos National Park, Mexico Species Genotype Date Depth Location Latitude, Longitude P. divaricata 1–9 7/5/09 2.7 m El Islote 20°55.607′N, 86°49.882′W P. astreoides 1–9 7/4/09 3m El Islote 20°55.607′N, 86°49.882′W O. faveolata 5,9 7/6/09 7.9 m The Wall 20°49.432′N, 86°52.664’W O. faveolata 8 7/9/09 4m Jardines 20°50.045′N, 86°52.694′W O. faveolata 1–4, 6, 7 7/9/09 2.4 m Radio Pirata 20°51.260′N, 86°51.909′W Table S2 Results of two factorial MANOVAs assessing the effects of coral species (S) and bleaching status (T) on the composition of captured zooplankton by size and taxa in a) Year 1 and b) Year 2. Pillai’s trace statistic is presented as all four MANOVA statistics were the same or similar a) Year 1 Effect T S TxS df 3, 14 6, 30 6, 30 Zooplankton size V-statistic 0.81 0.81 1.82 p-value 0.4622 0.5275 0.1276 Zooplankton composition df V-statistic p-value 9, 10 0.64 0.7420 18, 22 1.37 0.2411 18, 22 0.83 0.6480 Zooplankton Size Zooplankton Taxa b) Year 2 Effect df V-statistic p-value df V-statistic p-value T 3, 14 0.28 0.1945 8, 9 0.46 0.5134 S 6, 30 0.19 0.7863 18, 22 0.83 0.5873 TxS 6, 30 0.06 0.9851 18, 22 0.61 0.8909 df, degrees of freedom, V-statistic is the value of the Pillai’s trace statistic 1 32 32 30 30 28 (b) (c) 28 Reef 32 Control o Seawater temperature ( C) Single bleaching treatment . Repeat beaching treatment 30 28 26 (a) 24 J J 2009 A S O N D J F 2010 M A M J J A S O N Date Figure S1 (a) Average daily seawater temperature records throughout the study. Inset boxes show details of average daily profiles of the treatment and control tanks during (b) the 2009 bleaching and (c) the 2010 bleaching portions of the study. Months are indicated by their first letter. Modified from Grottoli et al. (2014) 2 Single Repeat a) b) Relative Zooplankton Community Composition 0.8 0.6 0.4 0.2 0.0 50-149 150-399 400-799 >800 50-149 Zooplankton Size Class ( m) 150-399 400-799 >800 Zooplankton Size Class ( m) 1.00 Proportion of Assemblage c) d) 0.75 0.50 0.25 0.00 OS SH EG IS SN CU AM CO PO CZ UN OS SH EG IS SN CU AM CO PO CZ UN Zooplankton Group Zooplankton Group Figure S2 Average proportion (± SE) of (a, b) size and (c, d) composition of zooplankton assemblage captured in plankton tows in (a, c) single and (b, d) repeat bleaching feeding trials. Zooplankton groups: UN = unidentified, CZ = crab zoea, PO = polychaetes, CO = copepods, AM = amphipods, CU = Cumaceae, SN = snails, IS = isopods, EG = eggs, SH = shrimp. 3

