Using Different Temperature Scales (activity)
advertisement
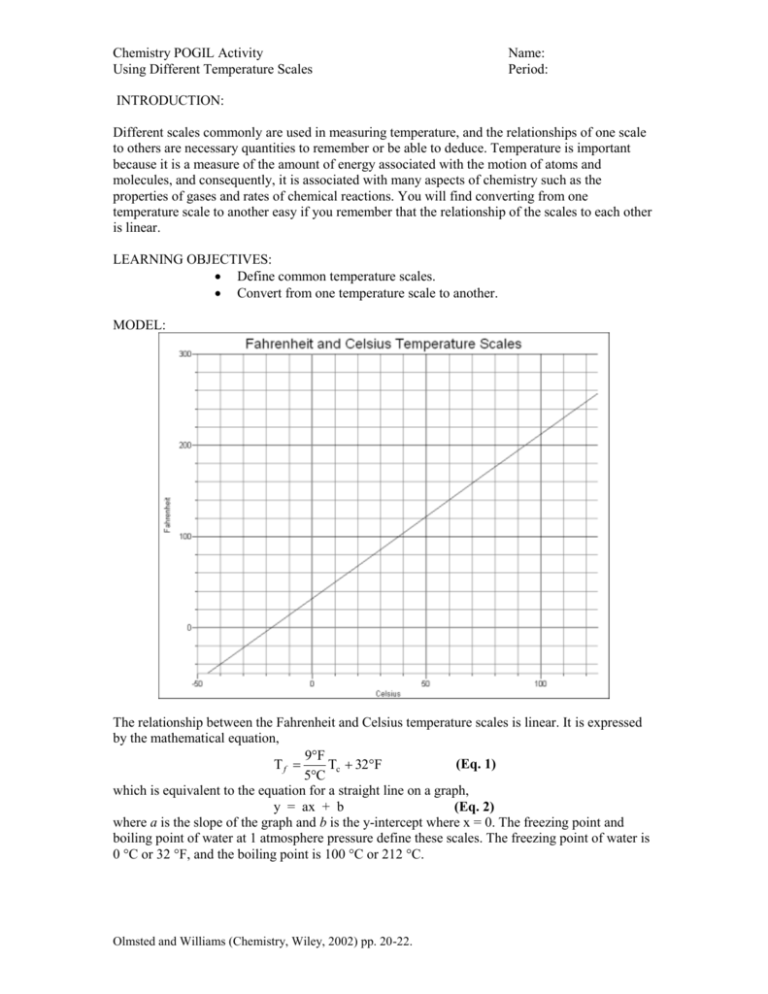
Chemistry POGIL Activity Using Different Temperature Scales Name: Period: INTRODUCTION: Different scales commonly are used in measuring temperature, and the relationships of one scale to others are necessary quantities to remember or be able to deduce. Temperature is important because it is a measure of the amount of energy associated with the motion of atoms and molecules, and consequently, it is associated with many aspects of chemistry such as the properties of gases and rates of chemical reactions. You will find converting from one temperature scale to another easy if you remember that the relationship of the scales to each other is linear. LEARNING OBJECTIVES: Define common temperature scales. Convert from one temperature scale to another. MODEL: The relationship between the Fahrenheit and Celsius temperature scales is linear. It is expressed by the mathematical equation, 9F (Eq. 1) Tf Tc 32F 5C which is equivalent to the equation for a straight line on a graph, y = ax + b (Eq. 2) where a is the slope of the graph and b is the y-intercept where x = 0. The freezing point and boiling point of water at 1 atmosphere pressure define these scales. The freezing point of water is 0 °C or 32 °F, and the boiling point is 100 °C or 212 °C. Olmsted and Williams (Chemistry, Wiley, 2002) pp. 20-22. Chemistry POGIL Activity Using Different Temperature Scales Name: Period: KEY QUESTIONS: 1. What properties of water are used to define two points on a temperature scale? 2. What is the form of the graph made by plotting the Fahrenheit temperature as a function of the Celsius temperature? 3. Are the sizes of the degrees the same or different on each of these scales? How do you know? 4. What is the relationship of the factor (9/5) in Eq. 1 to the graph? 5. In general, how can you derive or deduce the equation relating two linear temperature scales? EXERCISES: 1. Mark the freezing and boiling points of water on the graph line in the model. 2. For some temperature interval, determine the ratio of the number of Fahrenheit degrees to the number of Celsius degrees. 3. Identify how the value you obtained in Exercise 2 is related to the slope of the graph line in the model. 4. Derive the complementary equation that enables you to calculate Tc from Tf. Using Different Temperature Scales 5. Sketch the graph that corresponds to the equation you derived in Exercise 4. Put Tc on the yaxis and Tf on the x-axis. Olmsted and Williams (Chemistry, Wiley, 2002) pp. 20-22. Chemistry POGIL Activity Using Different Temperature Scales Name: Period: 6. Determine the values of the slope and the y-intercept for this graph line, and relate these values to your equation giving Tc as a function of Tf. 7. Complete the following table. Fahrenheit Celsius Kelvin 92 Example A hot summer day 15 80 -25 Boiling point of liquid air Cold winter day in the Midwest PROBLEM: (Hint: You might want to make a graph to answer the following) The voltage across a gallium arsenide diode often is used to measure low temperatures because it is stable, reproducible, and decreases linearly with increasing temperature above 20 K. The boiling points of liquid nitrogen (77.4 K) and liquid hydrogen (20.3 K) are used for calibration. Such a diode in a cryogenic chemistry laboratory at Stony Brook produces a voltage of 1.193 V when immersed in liquid nitrogen and 1.615 V when immersed in liquid hydrogen at one atmosphere pressure. (a) Derive an equation relating the Kelvin temperature to the diode voltage. (b) What is the Kelvin temperature when the diode voltage is 1.545 V? (c) What is the Celsius temperature at this diode voltage? (d) What is the Fahrenheit temperature at this diode voltage? Olmsted and Williams (Chemistry, Wiley, 2002) pp. 20-22. Chemistry POGIL Activity Using Different Temperature Scales Olmsted and Williams (Chemistry, Wiley, 2002) pp. 20-22. Name: Period:
