fwb12345-sup-0001-DataS1-S3-TableS1-S2
advertisement
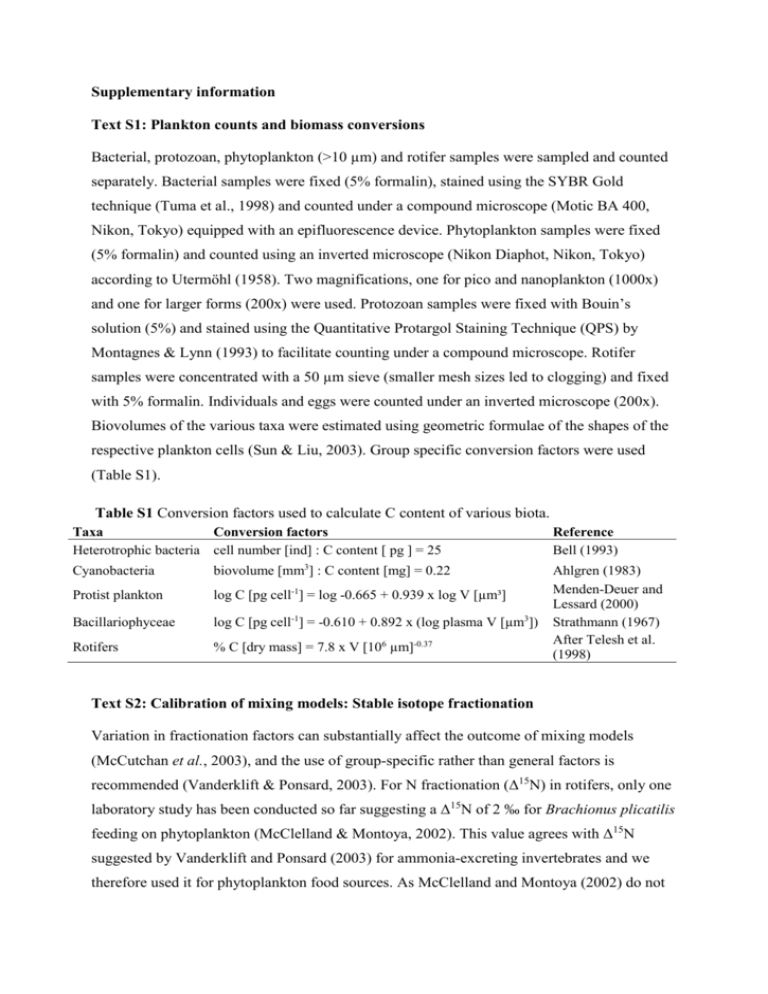
Supplementary information Text S1: Plankton counts and biomass conversions Bacterial, protozoan, phytoplankton (>10 µm) and rotifer samples were sampled and counted separately. Bacterial samples were fixed (5% formalin), stained using the SYBR Gold technique (Tuma et al., 1998) and counted under a compound microscope (Motic BA 400, Nikon, Tokyo) equipped with an epifluorescence device. Phytoplankton samples were fixed (5% formalin) and counted using an inverted microscope (Nikon Diaphot, Nikon, Tokyo) according to Utermöhl (1958). Two magnifications, one for pico and nanoplankton (1000x) and one for larger forms (200x) were used. Protozoan samples were fixed with Bouin’s solution (5%) and stained using the Quantitative Protargol Staining Technique (QPS) by Montagnes & Lynn (1993) to facilitate counting under a compound microscope. Rotifer samples were concentrated with a 50 µm sieve (smaller mesh sizes led to clogging) and fixed with 5% formalin. Individuals and eggs were counted under an inverted microscope (200x). Biovolumes of the various taxa were estimated using geometric formulae of the shapes of the respective plankton cells (Sun & Liu, 2003). Group specific conversion factors were used (Table S1). Table S1 Conversion factors used to calculate C content of various biota. Taxa Conversion factors Heterotrophic bacteria cell number [ind] : C content [ pg ] = 25 Cyanobacteria biovolume [mm3] : C content [mg] = 0.22 Protist plankton log C [pg cell-1] = log -0.665 + 0.939 x log V [µm³] Bacillariophyceae log C [pg cell-1] = -0.610 + 0.892 x (log plasma V [µm3]) Rotifers % C [dry mass] = 7.8 x V [106 µm]-0.37 Reference Bell (1993) Ahlgren (1983) Menden-Deuer and Lessard (2000) Strathmann (1967) After Telesh et al. (1998) Text S2: Calibration of mixing models: Stable isotope fractionation Variation in fractionation factors can substantially affect the outcome of mixing models (McCutchan et al., 2003), and the use of group-specific rather than general factors is recommended (Vanderklift & Ponsard, 2003). For N fractionation (Δ15N) in rotifers, only one laboratory study has been conducted so far suggesting a Δ15N of 2 ‰ for Brachionus plicatilis feeding on phytoplankton (McClelland & Montoya, 2002). This value agrees with Δ15N suggested by Vanderklift and Ponsard (2003) for ammonia-excreting invertebrates and we therefore used it for phytoplankton food sources. As McClelland and Montoya (2002) do not report uncertainty values of their measurements, we used the standard error of 0.19 as provided by Vanderklift and Ponsard (2003) instead. Detritus-feeding organisms, however, are known to have a significantly lower Δ15N than herbivores (Vanderklift & Ponsard, 2003, Matthews & Mazumder, 2008). Because no data for detritus-feeding rotifers exist, we used 0.5 ± 0.7 ‰ as Δ15N for bacterial and detrital food sources, as suggested for detritus-feeding organisms (Vanderklift & Ponsard, 2003). For carbon fractionation (Δ13C) also no rotifer-specific data were available. We therefore used 0.3 ± 0.14 ‰ as suggested by (McCutchan et al., 2003) for invertebrates. This is in line with values suggested by Grey et al. (2001) for crustacean zooplankton and with other reviews about variations of Δ13C (Vander Zanden & Rasmussen, 2001, Post, 2002). Table S2 Isotopic signatures of δ13C, δ15N and C:N ratios of major food web components of Lake Nakuru (April 7, 2009). Isotopic ratios are given in ‰, C:N ratios in % group/taxon DOM Sediment Allochthonous matter Macrophytes Cyanobacteria ≥40 µm 20<40 µm 2<20 µm <2µm Heterotrophic bacteria Arthrospira fusiformis Anabaenopsis elenkinii Brachionus dimidiatus Brachionus plicatilis Ephydra sp. n 6 6 3 3 6 6 6 6 * * * 3 3 2 Oreochromis a. grahami 3 Corixidae 6 Leptochironomus deribae 5 Lepidoptera 2 * calculated values, see text mean δ13C -17.83 -18.28 -8.79 -12.04 -22.34 -21.40 -20.17 -19.46 -16.83 -23.29 -15.76 -16.47 -20.55 -16.85 -16.80 -15.40 -17.80 -16.90 SD δ13C 0.07 0.48 0.31 0.46 0.06 0.89 0.59 0.60 0.36 0.51 0.14 0.08 0.27 0.21 0.45 0.86 2.44 mean δ15N 6.13 10.63 8.53 -2.78 4.30 4.01 4.42 6.70 9.53 4.24 4.24 10.14 8.65 4.53 6.25 8.01 9.75 - SD δ15N 0.09 0.32 0.22 0.52 0.23 0.85 0.64 1.16 0.62 0.62 0.91 1.07 0.90 0.47 0.72 0.32 - mean C:N 13.92 8.37 26.11 19.70 4.91 4..1 5.64 5.50 5.48 5.05 4.31 3.47 4.16 4.48 - SD C:N 0.24 0.47 3.24 0.91 0.07 0.62 0.25 0.21 0.06 0.13 014 0.09 0.15 0.28 - Text S3: Separation of cyanobacteria stable isotope signatures via an inverted endmember mixing model This calculation approach is based on the assumptions that the difference in the cyanobacterial δ13C values is caused by generic differences between the two cyanobacteria. Vuorio et al. (2009) showed that there also exist isotopic differences depending on the size of colonies. However, we believe for two reasons that size is not a main factor for isotopic differences in our study: First, changes of δ13C with colony size are dependent on changes of the surface/ volume ratio of the colony. But in contrast to spherical colonies, spiral-formed cyanobacteria increase in length, which results in a minimal change of thfe surface/ volume ratio. Second, if size was the decisive factor, we would argue that it would, based on the same physical principle, affect both N and C isotopes. But we found only a significant change in δ13C values of the two cyanobacteria, suggesting that the observed isotopic differences are rather derived from real differences between the two algae species and are not dependent on changes of δ13C values with changes in colony size. References Ahlgren, G. (1983) Comparison of methods for estimation of phytoplankton carbon. Archiv Fur Hydrobiologie, 98, 489–508. Bell, R.T. (1993) Estimating production of heterotrophic bacterioplankton via incorporation of tritiated thymidine. In: Handb. Aquat. Microb. Meth., p. 495-503. (Eds B.S. Pf Kemmp, Eb Sherr, Jj Cole ). Lewis Publishers. Grey, J., Jones, R.I. & Sleep, D. (2001) Seasonal changes in the importance of the source of organic matter to the diet of zooplankton in Loch Ness, as indicated by stable isotope analysis. Limnology and Oceanography, 46, 505-513. Matthews, B. & Mazumder, A. (2008) Detecting trophic-level variation in consumer assemblages. Freshwater Biology, 53, 1942-1953. McClelland, J.W. & Montoya, J.P. (2002) Trophic relationships and the nitrogen isotopic composition of amino acids in plankton. Ecology, 83, 2173-2180. McCutchan, J.H., Lewis, W.M., Kendall, C. & Mcgrath, C.C. (2003) Variation in trophic shift for stable isotope ratios of carbon, nitrogen, and sulfur. Oikos, 102, 378-390. Menden-Deuer, S. & Lessard, E.J. (2000) Carbon to volume relationships for dinoflagellates, diatoms, and other protist plankton. Limnology and Oceanography, 45, 569-579. Post, D.M. (2002) Using stable isotopes to estimate trophic position: Models, methods, and assumptions. Ecology, 83, 703-718. Strathmann, R. (1967) Estimating Organic Carbon Content of Phytoplankton from Cell Volume or Plasma Volume. Limnology and Oceanography, 12, 411-418. Telesh, I.V., Rahkola, M. & Viljanen, M. (1998) Carbon content of some freshwater rotifers. Hydrobiologia, 387, 355-360. Utermöhl, H. (1958) Zur Vervollkommnung der quantitativen Phytoplankton Methodik. Mitteilung Internationale Vereinigung für Theoretische und Angewandte Limnologie, 9, 1–38. Vander Zanden, M.J. & Rasmussen, J.B. (2001) Variation in delta N-15 and delta C-13 trophic fractionation: Implications for aquatic food web studies. Limnology and Oceanography, 46, 2061-2066. Vanderklift, M.A. & Ponsard, S. (2003) Sources of variation in consumer-diet delta N-15 enrichment: a meta-analysis. Oecologia, 136, 169-182. Vuorio, K., Meili, M. & Sarvala, J. (2009) Natural isotopic composition of carbon (delta C13) correlates with colony size in the planktonic cyanobacterium Gloeotrichia echinulata. Limnology and Oceanography, 54, 925-929.
