Constant Motion Lab
advertisement
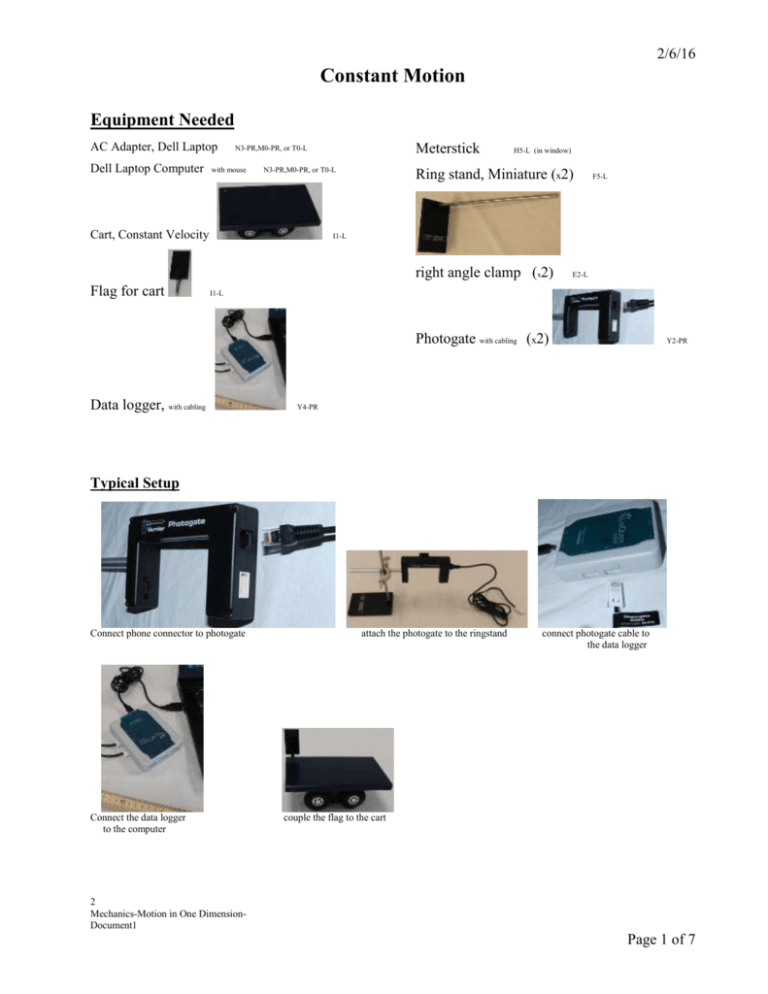
2/6/16 Constant Motion Equipment Needed AC Adapter, Dell Laptop Dell Laptop Computer Meterstick N3-PR,M0-PR, or T0-L with mouse N3-PR,M0-PR, or T0-L Cart, Constant Velocity H5-L (in window) Ring stand, Miniature (x2) I1-L right angle clamp (x2) Flag for cart F5-L E2-L I1-L Photogate with cabling (x2) Data logger, with cabling Y2-PR Y4-PR Typical Setup Connect phone connector to photogate Connect the data logger to the computer attach the photogate to the ringstand connect photogate cable to the data logger couple the flag to the cart 2 Mechanics-Motion in One DimensionDocument1 Page 1 of 7 Ver.07-04-01 Basic setup alternative setup view Note: adjust the height of the photogates so the flag will trigger the photogate without hitting it. Introduction The purpose of this lab is the study the concept of constant motion and its mathematical description. This will be done using the computer data collection system. The data will be interpreted using Microsoft Excel® to create graphs from the data. We will also see the importance of units when describing our data. Units play an essential role in any measurement. When we measure a physical quantity, we report it as a number followed by some unit. In this lab we will measure distances that we will report in inches and in centimeters, and we will measure time that we will report in seconds. Document1 Page 2 of 7 Ver.07-04-01 Procedure Caution: The carts are equipped with geared motors. The gears are plastic and can be easily broken. Do not try to force the cart to move manually or attempt to stop it my holding it. To operate the Start-Stop switch on the cart it is best to pick it up. 1. On the desktop double click on LoggerPro. In the upper left corner of Logger Pro, click File, Open. Then thread your way thru the following folders: Probes & Sensors -> Photogates -> Pulse Timer-Two Gates.cmbl. All you will need from the data table is the time for each run. 2. Consult the typical set-up picture on the first page. This is what your initial setup will look like. The meterstick will be centimeter side up. 3. Place the photogates with the separation distance associated with the trial run. If you start toward one end you will only have to move only one photogate for each successive run. 4. Click the Collect button on the menu at the top of the screen. When the stop button comes on, you are ready to start the cart and run it through the two photogates. 5. After you complete the run, click the Stop button and record you time in the table provided on the following page. 6. Repeat the run two more times. 7. Repeat steps 3, 4, 5, and 6 for each value shown in Table 1. Document1 Page 3 of 7 Ver.07-04-01 Table 1 Trial 1 Distance versus Time Distance Time ( ) ( ) 10 Average and std. dev. 2 20 Average and std. dev. 3 30 Average and std. dev. 4 40 Average and std. dev. 5 50 Average and std. dev. Document1 Page 4 of 7 Ver.07-04-01 Now turn the meter stick to the inch side up. 8. Repeat steps 3, 4, and 5 for each value shown in Table 2. Table 2 Trial 1 Distance versus Time Distance Time ( ) ( ) 4 Average and std. dev. 2 8 Average and std. dev. 3 12 Average and std. dev. 4 16 Average and std. dev. 5 20 Average and std. dev. Table 3 Document1 Page 5 of 7 Ver.07-04-01 Data Analysis 1. Use Excel® to enter your data. 2. Create a separate graph for each set of data. a. Be sure to fill out all labels. b. Don’t forget the units of measurement. 3. On the menu under chart click Add Trendline. a. Use the linear model. b. Click the Options tab. c. Check the Display equation on chart option box. 4. Using the equation, y mx b , what is the slope of each graph? Slope of graph for data from Table 1 Slope of graph for data from Table 2 5. What does the slope signify? 6. Convert the data in the Table 2 to the same units of the data in Table 1. 7. Compare the slope taken in each chart and calculate the % difference between the slope of the graph of the data from Table 1 and the slope of the graph of the data from Table 2. NOTE: Percent difference is a percentage that expresses the accuracy of the two values, where neither of the values represents an accepted standard value The expression for the percent difference of any two values, E1 and E2, is |𝐸1 −𝐸2 | Percent Difference = 1 (𝐸1 +𝐸2 ) 2 Document1 Page 6 of 7 Ver.07-04-01 Qualitative Error Analysis (Answer on separate paper and attached to this lab) 8. What systematic errors are present in your time measurements? How can you reduce these errors? 9. What random errors are present in your time measurements? How can you reduce these errors? 10. What systematic errors are present in your distance measurements? How can you reduce these errors? 11. What random errors are present in your distance measurements? How can you reduce these errors? Document1 Page 7 of 7
