Appendix S1. Description of fatality studies conducted
advertisement
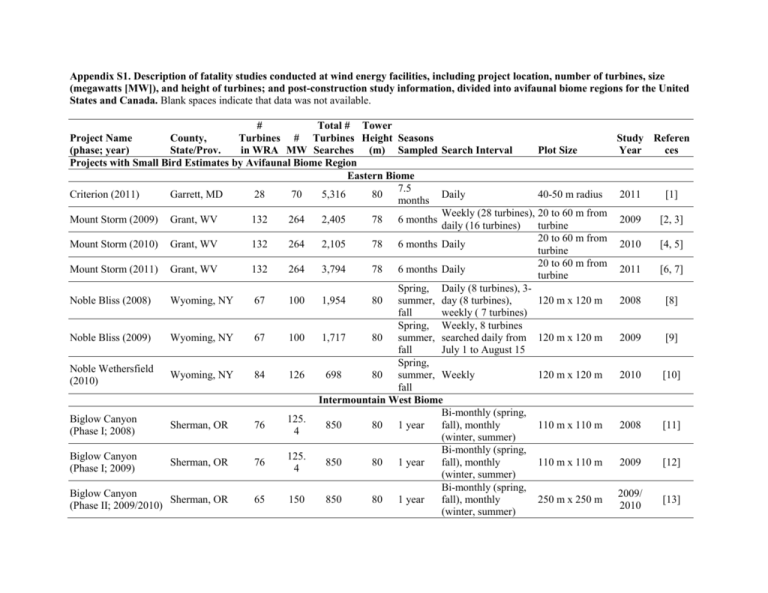
Appendix S1. Description of fatality studies conducted at wind energy facilities, including project location, number of turbines, size (megawatts [MW]), and height of turbines; and post-construction study information, divided into avifaunal biome regions for the United States and Canada. Blank spaces indicate that data was not available. # Total # Tower Project Name County, Turbines # Turbines Height Seasons Study Referen (phase; year) State/Prov. in WRA MW Searches (m) Sampled Search Interval Plot Size Year ces Projects with Small Bird Estimates by Avifaunal Biome Region Eastern Biome 7.5 Criterion (2011) Garrett, MD 28 70 5,316 80 Daily 40-50 m radius 2011 [1] months Weekly (28 turbines), 20 to 60 m from Mount Storm (2009) Grant, WV 132 264 2,405 78 6 months 2009 [2, 3] daily (16 turbines) turbine 20 to 60 m from Mount Storm (2010) Grant, WV 132 264 2,105 78 6 months Daily 2010 [4, 5] turbine 20 to 60 m from Mount Storm (2011) Grant, WV 132 264 3,794 78 6 months Daily 2011 [6, 7] turbine Spring, Daily (8 turbines), 3Noble Bliss (2008) Wyoming, NY 67 100 1,954 80 summer, day (8 turbines), 120 m x 120 m 2008 [8] fall weekly ( 7 turbines) Spring, Weekly, 8 turbines Noble Bliss (2009) Wyoming, NY 67 100 1,717 80 summer, searched daily from 120 m x 120 m 2009 [9] fall July 1 to August 15 Spring, Noble Wethersfield Wyoming, NY 84 126 698 80 summer, Weekly 120 m x 120 m 2010 [10] (2010) fall Intermountain West Biome Bi-monthly (spring, Biglow Canyon 125. Sherman, OR 76 850 80 1 year fall), monthly 110 m x 110 m 2008 [11] (Phase I; 2008) 4 (winter, summer) Bi-monthly (spring, Biglow Canyon 125. Sherman, OR 76 850 80 1 year fall), monthly 110 m x 110 m 2009 [12] (Phase I; 2009) 4 (winter, summer) Bi-monthly (spring, Biglow Canyon 2009/ Sherman, OR 65 150 850 80 1 year fall), monthly 250 m x 250 m [13] (Phase II; 2009/2010) 2010 (winter, summer) # Total # Tower Turbines # Turbines Height Seasons in WRA MW Searches (m) Sampled Search Interval Bi-weekly(spring, Biglow Canyon Sherman, OR 65 150 799 80 1 year fall), monthly (Phase II; 2010/2011) (summer, winter) Bi-weekly(spring, Biglow Canyon 174. Sherman, OR 76 800 80 1 year fall), monthly (Phase III, 2010/2011) 8 (summer, winter) Project Name (phase; year) County, State/Prov. Combine Hills (2004) Umatilla, OR 41 41 574 53 1 year Monthly Bi-weekly(spring, fall), monthly (summer, winter) Bi-monthly (spring, fall), monthly (winter, summer) Twice weekly (spring, summer, fall), weekly (winter) Monthly Bi-monthly (spring, fall), monthly (winter, summer) Plot Size 252 m x 252 m 2010/ 2011 [14] 252 m x 252 m 2010/ 2011 [15] 90-m radius 2004/ 2005 [16] 180 m x 180 m 2011 [17] 160 m x 160 m 2009/ 2010 [18] 160 m x 160 m 20112012 [19] 220 m x 220 m 2008 [20] 220 m x 220 m 2010 [21] Combine Hills (2011) Umatilla, OR 104 104 955 53 1 year Dry Lake I Navajo, AZ 30 63 768 78 1 year Dry Lake II Navajo, AZ 31 65 78 1 year Elkhorn (2008) Union, OR 61 101 732 80 1 year Elkhorn (2010) Union, OR 61 101 619 80 1 year 69 41.4 42 40 1 year Monthly 126 m x 126 m 69 41.4 42 40 1 year Monthly 126 m x 126 m 69 41.4 42 40 1 year Monthly 126 m x 126 m 1 year 14 days during migration periods, 28 180 m x 180 m days during nonmigration periods Foote Creek Rim Carbon, WY (Phase I; 1999) Foote Creek Rim Carbon, WY (Phase I; 2000) Foote Creek Rim Carbon, WY (Phase I; 2001-2002) Goodnoe Klickitat, WA 47 94 455 80 Study Referen Year ces 19982002 19982002 19982002 2009/ 2010 [22] [22] [22] [23] # Total # Tower Turbines # Turbines Height Seasons in WRA MW Searches (m) Sampled Search Interval Bi-monthly (spring, 100. Hay Canyon Sherman, OR 48 320 79 1 year fall), monthly 8 (winter, summer) Monthly, weekly Columbia, (subset of 22 turbines Hopkins Ridge (2006) 83 150 865 67 1 year WA spring and fall migration) Bi-monthly (spring, Columbia, 156. Hopkins Ridge (2008) 87 713 67 1 year fall), monthly WA 6 (winter, summer) Bi weekly from Aug 15 - Oct 31 and Kittitas Valley (2011100. March 16 - May 15; Kittitas, WA 48 815 80 1 year 2012) 8 every 4 weeks from Nov 1 - March 15 and May 16 - Aug 14 Project Name (phase; year) County, State/Prov. Klondike Sherman, OR 16 24 208 80 1 year Klondike II Sherman, OR 50 75 500 80 1 year Klondike III (Phase I) Sherman, OR 125 223. 6 1,426 80 2 year Klondike IIIa (Phase II) Sherman, OR 51 76.5 1,088 80 2 years Linden Ranch Klickitat, WA 25 50 441 80 1 year Monthly Bi-monthly (spring, fall), monthly (summer, winter) Bi-monthly (spring, fall migration), monthly (summer, winter) Bi-monthly (spring, fall), monthly (summer, winter) Bi-weekly(spring, fall), monthly (summer, winter) Plot Size Study Referen Year ces 180 m x 180 m 2009/ 2010 [24] 180 m x 180 m 2006 [25] 180 m x 180 m 2008 [26] 100 m x 102 m 2011/ 2012 [27] 140 m x 140 m 2002/ 2003 [28] 180 m x 180 m 2005/ 2006 [29] 240 m x 240 m (1.5MW) 252 m 2007x 252 m 2009 (2.3MW) [30] 240 m x 240 m 20082010 [31] 110 m x 110 m 2010 [32] Project Name (phase; year) County, State/Prov. Marengo I (2009) Columbia, WA Marengo II (2009) Columbia, WA Nine Canyon Benton, WA # Total # Tower Turbines # Turbines Height Seasons in WRA MW Searches (m) Sampled Search Interval Bi-monthly (spring, 140. 78 67 1 year fall), monthly 4 (winter, summer) Bi-monthly (spring, 39 70.2 360 67 1 year fall), monthly (winter, summer) Bi-monthly (spring, 37 48.1 703 60 1 year summer, fall), monthly (winter) Vansycle Walla Walla, WA and Umatilla, OR Walla Walla, WA and Umatilla, OR Walla Walla, WA and Umatilla, OR Umatilla, OR Vantage Kittitas, WA 60 90 520 80 1 year Wild Horse Kittitas, WA 127 229 1,088 67 1 year Windy Flats (Windy Point II) Klickitat, WA 114 262. 2 685 80 1 year Stateline (2002) Stateline (2003) Stateline (2006) Plot Size Study Referen Year ces 180 m x 180 m 2009/ 2010 [33] 180 m x 180 m 2009/ 2010 [34] 90-m radius 2002/ 2003 [35] 454 300 668 50 1 year Bi-weekly, monthly Minimum 126 m x 126 m 2002 [36] 454 300 668 50 1 year Bi-weekly, monthly Minimum 126 m x 126 m 2003 [36] 454 300 668 50 1 year Bi-weekly Variable turbine strings 2006 [37] 38 24.9 456 50 1 year Monthly Monthly, a subset of 10 searched weekly during migration Monthly, weekly (fall, spring migration at 16 turbines) Monthly (spring, summer, fall, and winter), weekly (spring and fall migration) 126 m x 126 m 1999 [38] 240 m x 240 m 2010/ 2011 [39] 110 m from two turbines in plot 2007 [40] 180 m x 180 m (120m at MET tower) 2010 [41] Project Name (phase; year) County, State/Prov. Lempster (2010) Sullivan, NH Maple Ridge (2007) Lewis, NY Maple Ridge (2008) Lewis, NY Noble Altona (2010) Clinton, NY Noble Chateaugay (2010) Franklin, NY Noble Clinton (2008) Clinton, NY # Total # Tower Turbines # Turbines Height Seasons in WRA MW Searches (m) Sampled Northern Forest Biome 12 24 289 78 6 months 321. 195 1,736 80 7 months 75 321. 195 1,882 80 7 months 75 Spring, 65 97.5 964 80 summer, fall Spring, 106. 71 600 80 summer, 5 fall Spring, 67 100 1,158 80 summer, fall Noble Clinton (2009) Clinton, NY 67 100 1,774 80 Noble Ellenburg (2008) Clinton, NY 54 80 1,068 80 Noble Ellenburg (2009) Clinton, NY 54 80 1,359 80 Search Interval Plot Size Study Referen Year ces Weekly 120 m x 130 m 2010 [42] Weekly 130 m x 120 m 2007 [43] Weekly 130 m x 120 m 2008 [44] Daily, weekly 120 m x 120 m 2010 [45] Weekly 120 m x 120 m 2010 [46] 120 m x 120 m 2008 [47] 120 m x 120 m 2009 [48] 120 m x 120 m 2008 [49] 120 m x 120 m 2009 [50] Daily (8 turbines), 3day (8 turbines) weekly (7 turbines Daily (8 turbines), Spring, weekly (15 turbines), summer, all turbines weekly fall from July 1 to August 15 Spring, Daily (6 turbines), 3summer, day (6 turbines), fall weekly (6 turbines) Daily (6 turbines), Spring, weekly (12 turbines), summer, all turbines weekly fall from July 1 to August 15 Project Name (phase; year) Alite (2010) Diablo Dillon a # Total # Tower Turbines # Turbines Height Seasons in WRA MW Searches (m) Sampled Search Interval Pacific Biome Weekly (spring, fall), Kern, CA 8 24 317 80 1 year bi-monthly (summer, winter) 20.4 Alameda, CA 31 682 50 & 55 2 years Monthly 6 Weekly, bi-monthly Riverside, CA 45 45 471 69 1 year in winter County, State/Prov. Plot Size 200 m x 200 m 75 m x 75 m 200 m x 200 m Pine Tree Kern, CA 90 135 25 65 1 year Bi-weekly n/a Shiloh I Solano, CA 100 150 7,771 65 3 years Weekly 105-m radius Weekly 100 m radius 115 (33 turbs), 1,293 1 year 125 (42 turbs) Prairie Biome Shiloh II (Year 1) Solano, CA 75 150 Barton Chapel Jack, TX 60 120 88 145 1,869 80 67 134 336 80 155 233 73 25.6 1,362 36 1 year 73 25.6 1,362 36 1 year 73 25.6 1,362 36 1 year 73 25.6 1,362 36 1 year Blue Sky Green Field Buffalo Gap I Fond du Lac, WI Nolan and Taylor, TX Buffalo Gap II Nolan, TX Buffalo Ridge (Phase I; 1996) Buffalo Ridge (Phase I; 1997) Buffalo Ridge (Phase I; 1998) Buffalo Ridge (Phase I; 1999) Lincoln and Pipestone, MN Lincoln and Pipestone, MN Lincoln and Pipestone, MN Lincoln and Pipestone, MN 78 80 1 year Fall, spring 10 months 14 months Study Referen Year ces 2009/ 2010 20052007 2008/ 2009 2009/ 2010 20062009 [51] [52, 53] [54] [55] [56] 2009/ 2010 [57] 10 turbines weekly, 200 m x 200 m 20 monthly Daily(10 turbines), 160 m x 160 m weekly (20 turbines) 2009/ 2010 [58] 2008 [59] Every 3 weeks 215 m x 215 m 2006 [60] Every 21 days 215 m x 215 m Bi-monthly (spring, summer, and fall) Bi-monthly (spring, summer, and fall) Bi-monthly (spring, summer, and fall) Bi-monthly (spring, summer, and fall) 126 m x 126 m 126 m x 126 m 126 m x 126 m 126 m x 126 m 2007/ 2008 19961999 19961999 19961999 19961999 [61] [62] [62] [62] [62] Project Name (phase; year) Buffalo Ridge (Phase II; 1998) Buffalo Ridge (Phase II; 1999) Buffalo Ridge (Phase III; 1999) Buffalo Ridge I (2010) Buffalo Ridge II (2011) Cedar Ridge (2009) Cedar Ridge (2010) Elm Creek # Total # Tower County, Turbines # Turbines Height Seasons State/Prov. in WRA MW Searches (m) Sampled Search Interval Lincoln and 107. Bi-monthly (spring, 143 1,106 50 1 year Pipestone, MN 25 summer, and fall) Lincoln and 107. Bi-monthly (spring, 143 1,106 50 1 year Pipestone, MN 25 summer, and fall) Lincoln and 103. Bi-monthly (spring, 138 372 50 1 year Pipestone, MN 5 summer, and fall) Weekly (migratory), Brookings, SD 24 50.4 432 79 1 year monthly (nonmigratory) Weekly (spring, Brookings and 105 210 78 1 year summer, fall), Deuel, SD monthly (winter) Spring, Daily, every 4 days; Fond du Lac, 41 67.6 1,702 80 summer, late fall searched WI fall every 3 days Five turbines were surveyed daily, 15 1,702 turbines surveyed Fond Du Lac, (2009) every 4 days in 41 68 80 1 year WI and 1,448 rotating groups each (2010) day. All 20 surveyed every three days during late fall Jackson, MN 67 100 448 80 1 year Elm Creek II Jackson and Martin, MN 62 148. 8 427 80 1 year Grand Ridge I LaSalle, IL 66 99 441 80 1 year Weekly, monthly Plot Size 126 m x 126 m 126 m x 126 m 126 m x 126 m Study Referen Year ces 1996[62] 1999 1996[62] 1999 1996[62] 1999 200 m x 200 m 2009/ 2010 [63] 100 m x 100 m 2011/ 2012 [64] 160 m x 160 m 2009 [65] 160 m x 160 m 2010 [66] 200 m x 200 m 2009/ 2010 [67] 200 x 200m (2 20 searched every 28 random days, 10 turbines 2011/ migration every 7 days during 2012 search areas 100 migration) x 100m) 2009/ Weekly, monthly 160 m x 160 m 2010 [68] [69] # Total # Tower Turbines # Turbines Height Seasons in WRA MW Searches (m) Sampled Search Interval Plot Size Spring, NPPD Ainsworth Brown, NE 36 59.4 70 summer, Bi-monthly 220 m x 220 m fall Twice monthly Aurora, Brule, Prairie Winds SD1 (spring, summer, and Jerauld, 108 162 80 1 year 200 m x 200 m (Crow Lake) fall), monthly SD (winter) Weekly (spring, fall; migratory turbines), Rugby Pierce, ND 71 149 442 78 1 year 200 m x 200 m monthly ( nonmigratory turbines) Spring, Wessington Springs Jerauld, SD 34 51 319 80 summer, Bi-monthly 200 m x 200 m (2009) fall Wessington Springs Bi-weekly (spring, Jerauld, SD 34 51 357 80 8 months 200 m x 200 m (2010) summer, fall) Weekly (migratory), Winnebago, Winnebago 10 20 175 78 1 year monthly (non200 m x 200 m IA migratory) Projects with All Bird Estimates (where small bird estimates were not available) by Avifaunal Biome Region. Eastern Biome Buffalo Mountain Bi-weekly, weekly, Anderson, TN 3 1.98 645 65 3 years 50-m radius (2000-2003) bi-monthly Model Bi-weekly, weekly, Buffalo Mountain 28.9 V47 = Anderson, TN 18 40 1 year bi-monthly, and 2 to 50-m radius (2005) 8 65, V80 5 day intervals = 78 Casselman (2008) Somerset, PA 23 34.5 2,040 80 7 months Daily 126 m x 120 m Project Name (phase; year) County, State/Prov. Study Referen Year ces 2006 [70] 2011/ 2012 [71] 2010 [72] 2009 [73] 2010 [74] 2009/ 2010 [75] 20002003 [76] 2005 [77] 2008 [78] Project Name (phase; year) County, State/Prov. Casselman (2009) Somerset, PA Cohocton/Dutch Hill Steuben, NY (2009) Cohocton/Dutch Hills Steuben, NY (2010) Locust Ridge II (2009) Locust Ridge II (2010) Mountaineer (2003) Columbia and Schuykill, PA Columbia and Schuykill, PA Tucker, WV Munnsville (2008) Madison and Oneida, NY Ripley (2008) Bruce, Ontario Sheldon (2010) Wyoming, NY Sheldon (2011) Wyoming, NY Big Horn Klickitat, WA Harvest Wind (2010Klickitat, WA 2012) # Total # Tower Turbines # Turbines Height Seasons in WRA MW Searches (m) Sampled Search Interval 7.5 23 34.5 2,241 80 Daily months 1,087 (804 Spring, Daily (5 turbines), 50 125 (daily), 80 summer, weekly (12 turbines) 283 fall (weekly)) Spring, 50 125 664 80 summer, Daily, weekly fall 6.5 51 102 80 Daily months 6.5 51 102 80 Daily months 44 66 954 80 7 months Weekly, monthly Spring, 23 34.5 69.5 summer, Weekly fall Twice weekly for Spring, 38 76 64 odd turbines; weekly fall for even turbines. 112. Daily (8 turbines), 75 2,188 80 7 months 5 weekly (17 turbines) 112. Daily (8 turbines), 75 2,136 80 7 months 5 weekly (17 turbines) Intermountain West Biome Bi-monthly (spring, 199. 133 2,261 80 1 year fall), monthly 5 (winter, summer) 43 98.9 184 80 2 years Plot Size Study Referen Year ces 126 m x 120 m 2009 [79] 130 m x 130 m 2009 [80] 120 m x 120 m 2010 [81] 126 m x 120 m 2009 [82] 126 m x 120 m 2010 [82] 60-m radius 2003 [83] 120 m x 120 m 2008 [84] 80 m x 80 m 2008 [85] 115 m x 115 m 2010 [86] 115 m x 115 m 2011 [87] 180 m x 180 m 2006/ 2007 [88] 180 m x 180 m Twice a week, & 240 m x 240 weekly and monthly m 2010/ 2011 [89] Project Name (phase; year) Leaning Juniper Pebble Springs Summerview (2006) Tuolumne (Windy Point I) White Creek (20072011) # Total # Tower Turbines # Turbines Height Seasons in WRA MW Searches (m) Sampled Search Interval Bi-monthly (spring, 100. Gilliam, OR 67 629 80 2 years fall), monthly 5 (winter, summer) Bi-monthly (spring, Gilliam, OR 47 98.7 320 79 1 year fall), monthly (winter, summer) Weekly, bi-weekly Alberta 39 70.2 2,574 67 1 year (May to July, September) Monthly throughout the year, a sub-set of 136. 10 turbines were also Klickitat, WA 62 509 80 1 year 6 searched weekly during the spring, summer, and fall County, State/Prov. Klickitat, WA 89 204. 7 Lempster (2009) Sullivan, NH 12 24 Mars Hill (2007) Aroostook, ME 28 42 Mars Hill (2008) Aroostook, ME 28 42 Stetson Mountain I (2009) Penobscot and Washington, ME 38 57 348 80 4 years Plot Size Study Referen Year ces 240 m x 240 m 20062008 [90] 180 m x 180 m 20092010 [91] 140 m x 140 m 2005/ 2006 [92] 180 m x 180 m 2009/ 2010 [93] 180 m x 180 m Twice a week, & 240 m x 240 weekly and monthly m 20072011 [94] 120 m x 130 m 2009 [95] 76-m diameter, extended plot 238-m diameter 2007 [96] 76-m diameter, extended plot 238-m diameter 2008 [97] 76-m diameter 2009 [98] Northern Forest Biome 598 78 6 months Daily Daily (2 random Spring, turbines), weekly (all 80.5 summer, turbines): extended fall plot searched once per season Spring, Weekly: extended 80.5 summer, plot searched once fall per season 27 weeks (spring, 506 80 Weekly summer, fall) Project Name (phase; year) Stetson Mountain I (2011) Stetson Mountain II (2010) County, State/Prov. Washington, ME Washington, ME # Total # Tower Turbines # Turbines Height Seasons in WRA MW Searches (m) Sampled Search Interval Plot Size Study Referen Year ces Varied 2011 [99] Weekly (3 turbines twice a week) Varied 2010 [100] 38 57 513 80 6 months Weekly 17 25.5 552 80 6 months Pacific Biome High Winds (2004) Solano, CA 90 162 2,070 60 1 year Bi-monthly 75-m radius High Winds (2005) Solano, CA 90 162 2,150 60 1 year Bi-monthly 75-m radius 2003/ 2004 2004/ 2005 [101] [101] Prairie Biome Barton I and II Worth, IA 80 160 Kewaunee County Kewaunee, WI 31 20.4 6 Moraine II Pipestone and Murray, MN 33 49.5 Pioneer Prairie I (Phase II) Mitchell, IA 62 102. 3 Ward, ND 80 Ward, ND 80 Prairie Winds ND1/Minot (2010) Prairie Winds ND1/Minot (2011) 115. 5 115. 5 405 440 Weekly (spring, fall; migratory turbines), monthly (summer, winter; nonmigratory turbines) Bi-weekly (spring, summer), daily (spring, fall migration), weekly (fall, winter) Weekly (migratory), monthly (nonmigratory) Weekly (spring and fall), every two weeks (summer), monthly (winter) 100 1 year 65 2 years 82.5 1 year 80 1 year 89 3 seasons Bi-monthly 80 3 seasons Twice monthly 200 m x 200 m 2010/ 2011 [102] 60 m x 60 m 19992001 [103] 200 m x 200 m 2009 [104] 80 m x 80 m 2011/ 2012 [105] 2010 [106] 2011 [107] Minimum of 100 m x 100 m Minimum of 100 m x 100 m # Total # Tower Turbines # Turbines Height Seasons Study Referen in WRA MW Searches (m) Sampled Search Interval Plot Size Year ces Spring, Once every 2 to 3 Top of Iowa (2003) Worth, IA 89 80 6,214 71.6 summer, 76 m x 76 m 2003 [108] days fall Spring, Once every 2 to 3 Top of Iowa (2004) Worth, IA 89 80 6,214 71.6 summer, 76 m x 76 m 2004 [108] days fall a The Dillon Project was the only project in the Southwestern Biome represented by an available fatality report. Due to its singularity and since it is located very close to the Pacific Biome; it was combined with the Pacific Biome data. Project Name (phase; year) County, State/Prov. References: 1. Young, D.P. Jr., M. Lout, Z. Courage, S. Nomani, and K. Bay. 2012. 2011 Post-Construction Monitoring Study, Criterion Wind Project, Garrett County, Maryland: April - November 2011. Revised November 25, 2013. 2. Young, D.P. Jr., Bay K, Nomani S, Tidhar W (2009) Nedpower Mount Storm Wind Energy Facility, PostConstruction Avian and Bat Monitoring: March - June 2009. 3. Young, D.P. Jr., Bay K, Nomani S, Tidhar W (2010) Nedpower Mount Storm Wind Energy Facility, PostConstruction Avian and Bat Monitoring: July - October 2009. 4. Young, D.P. Jr., Bay K, Nomani S, Tidhar W (2010) Nedpower Mount Storm Wind Energy Facility, PostConstruction Avian and Bat Monitoring: April - July 2010. 5. Young, D.P. Jr., Nomani S, Tidhar W, Bay K (2011) Nedpower Mount Storm Wind Energy Facility, PostConstruction Avian and Bat Monitoring: July - October 2010. 6. Young, D.P. Jr., Nomani S, Courage Z, Bay K (2011) Nedpower Mount Storm Wind Energy Facility, PostConstruction Avian and Bat Monitoring: April - July 2011. 7. Young, D.P. Jr., Nomani S, Courage Z, Bay K (2012) Nedpower Mount Storm Wind Energy Facility, PostConstruction Avian and Bat Monitoring: July - October 2011. 8. Jain A, Kerlinger P, Curry R, Slobodnik L, Quant J, et al. (2009) Annual Report for the Noble Bliss Windpark, LLC, Postconstruction Bird and Bat Fatality Study - 2008. 9. Jain A, Kerlinger P, Slobodnik L, Curry R, Fuerst A, et al. (2010) Annual Report for the Noble Bliss Windpark, LLC: Postconstruction Bird and Bat Fatality Study - 2009. 10. Jain A, Kerlinger P, Slobodnik L, Curry R, Harte A (2011) Annual Report for the Noble Wethersfield Windpark, LLC: Postconstruction Bird and Bat Fatality Study - 2010. 11. Jeffrey JD, Bay K, Erickson WP, Sonneberg M, Baker J, et al. (2009) Portland General Electric Biglow Canyon Wind Farm Phase I Post-Construction Avian and Bat Monitoring First Annual Report, Sherman County, Oregon. January 2008 - December 2008. 12. Enk T, Bay K, Sonnenberg M, Baker J, Kesterke M, et al. (2010) Biglow Canyon Wind Farm Phase I PostConstruction Avian and Bat Monitoring Second Annual Report, Sherman County, Oregon. January 26, 2009 - December 11, 2009. 13. Enk T, Bay K, Sonnenberg M, Flaig J, Boehrs JR, et al. (2011) Year 1 Post-Construction Avian and Bat Monitoring Report: Biglow Canyon Wind Farm Phase II, Sherman County, Oregon. September 10, 2009 September 12, 2010. 14. Enk T, Bay K, Sonnenberg M, Boehrs JR (2012) Year 2 Avian and Bat Monitoring Report: Biglow Canyon Wind Farm Phase II, Sherman County, Oregon. September 13, 2010 - September 12, 2011. 15. Enk T, Bay K, Sonnenberg M, Boehrs JR (2012) Year 1 Avian and Bat Monitoring Report: Biglow Canyon Wind Farm Phase III, Sherman County, Oregon. September 13, 2010 - September 9, 2011. 16. Young, D.P. Jr., Jeffrey J, Erickson WP, Bay K, Poulton VK, et al. (2006) Eurus Combine Hills Turbine Ranch. Phase 1 Post Construction Wildlife Monitoring First Annual Report: February 2004 - February 2005. 17. Enz T, Bay K, Sonnenberg M, Palochak A (2012) Post-Construction Monitoring Studies for the Combine Hills Turbine Ranch, Umatilla County, Oregon. Final Report: January 7 - December 2, 2011. 18. Thompson J, Solick D, Bay K (2011) Post-Construction Fatality Surveys for the Dry Lake Phase I Wind Project. Iberdrola Renewables: September 2009 - November 2010. 19. Thompson J, Bay K (2012) Post-Construction Fatality Surveys for the Dry Lake II Wind Project: February 2011 – February 2012. 20. Jeffrey JD, Erickson WP, Bay K, Sonneberg M, Baker J, et al. (2009) Horizon Wind Energy, Elkhorn Valley Wind Project, Post-Construction Avian and Bat Monitoring, First Annual Report, January-December 2008. 21. Enk T, Derby C, Bay K, Sonnenberg M (2011) 2010 Post-Construction Fatality Monitoring Report, Elkhorn Valley Wind Farm, Union County, Oregon. January – December 2010. 22. Young, D.P. Jr., Erickson WP, Good RE, Strickland MD, Johnson GD (2003) Avian and Bat Mortality Associated with the Initial Phase of the Foote Creek Rim Windpower Project, Carbon County, Wyoming, Final Report, November 1998 - June 2002. 23. URS Corporation (2010) Final Goodnoe Hills Wind Project Avian Mortality Monitoring Report. 24. Gritski R, Kronner K (2010) Hay Canyon Wind Power Project Wildlife Monitoring Study: May 2009 - May 2010. 25. Young, D.P. Jr., Erickson WP, Jeffrey J, Poulton VK (2007) Puget Sound Energy Hopkins Ridge Wind Project Phase 1 Post-Construction Avian and Bat Monitoring First Annual Report, January - December 2006. 25 pp. p. 26. Young, D.P. Jr., Jeffrey JD, Bay K, Erickson WP (2009) Puget Sound Energy Hopkins Ridge Wind Project, Phase 1, Columbia County, Washington. Post-Construction Avian and Bat Monitoring, Second Annual Report: January - December, 2008. 27. Stantec Consulting Services, Inc. (Stantec Consulting Services) (2012) Post-Construction Monitoring, Summer 2011 - Spring 2012, Year 1 Annual Report: Kittitas Valley Wind Power Project, Cle Elum, Washington. 28. Johnson GD, Erickson WP, White J (2003) Avian and Bat Mortality During the First Year of Operation at the Klondike Phase I Wind Project, Sherman County, Oregon. 29. Northwest Wildlife Consultants, Inc. (NWC), Western EcoSystems Technology, Inc. (WEST) (2007) Avian and Bat Monitoring Report for the Klondike II Wind Power Project. Sherman County, Oregon. 30. Gritski R, Downes S, Kronner K (2010) Klondike III (Phase 1) Wind Power Project Wildlife Monitoring: October 2007-October 2009. 31. Gritski R, Downes S, Kronner K (2011) Klondike IIIa (Phase 2) Wind Power Project Wildlife Monitoring: August 2008 - August 2010. 32. Enz T, Bay K (2011) Post-Construction Monitoring at the Linden Ranch Wind Farm, Klickitat County, Washington. Final Report: June 30, 2010 - July 17, 2011. 33. URS Corporation (2010) Final Marengo I Wind Project Year One Avian Mortality Monitoring Report. 34. URS Corporation (2010) Final Marengo II Wind Project Year One Avian Mortality Monitoring Report. 35. Erickson WP, Kronner K, Gritski R (2003) Nine Canyon Wind Power Project Avian and Bat Monitoring Report. September 2002 – August 2003. 36. Erickson WP, Jeffrey J, Kronner K, Bay K (2004) Stateline Wind Project Wildlife Monitoring Annual Report. July 2001 - December 2003. 37. Erickson WP, Kronner K, Bay KJ (2007) Stateline 2 Wind Project Wildlife Monitoring Report, January December 2006. 38. Erickson WP, Johnson GD, Strickland MD, Kronner K (2000) Avian and Bat Mortality Associated with the Vansycle Wind Project, Umatilla County, Oregon: 1999 Study Year. 39. Ventus Environmental Solutions (Ventus) (2012) Vantage Wind Energy Center Avian and Bat Monitoring Study: March 2011- March 2012. 40. Erickson WP, Jeffrey J, Poulton VK (2008) Avian and Bat Monitoring: Year 1 Report. Puget Sound Energy Wild Horse Wind Project, Kittitas County, Washington. 41. Enz T, Bay K, Nomani S, Kesterke M (2011) Bird and Bat Fatality Monitoring Study, Windy Flats and Windy Point II Wind Energy Projects, Klickitat County, Washington. Final Report: February 1, 2010 - January 14, 2011. 42. Tidhar D, Tidhar WL, McManus L, Courage Z (2011) 2010 Post-Construction Fatality Surveys for the Lempster Wind Project, Lempster, New Hampshire. 43. Jain A, Kerlinger P, Curry R, Slobodnik L (2009) Annual Report for the Maple Ridge Wind Power Project: PostConstruction Bird and Bat Fatality Study - 2007. 44. Jain A, Kerlinger P, Curry R, Slobodnik L, Lehman M (2009) Maple Ridge Wind Power Avian and Bat Fatality Study Report - 2008. 45. Jain A, Kerlinger P, Slobodnik L, Curry R, Russell K (2011) Annual Report for the Noble Altona Windpark, LLC: Postconstruction Bird and Bat Fatality Study - 2010. 46. Jain A, Kerlinger P, Slobodnik L, Curry R, Russell K (2011) Annual Report for the Noble Chateaugay Windpark, LLC: Postconstruction Bird and Bat Fatality Study - 2010. 47. Jain A, Kerlinger P, Curry R, Slobodnik L, Histed J, et al. (2009) Annual Report for the Noble Clinton Windpark, LLC, Postconstruction Bird and Bat Fatality Study - 2008. 48. Jain A, Kerlinger P, Slobodnik L, Curry R, Russell K (2010) Annual Report for the Noble Clinton Windpark, LLC: Postconstruction Bird and Bat Fatality Study - 2009. 49. Jain A, Kerlinger P, Curry R, Slobodnik L, Fuerst A, et al. (2009) Annual Report for the Noble Ellenburg Windpark, LLC, Postconstruction Bird and Bat Fatality Study - 2008. 50. Jain A, Kerlinger P, Slobodnik L, Curry R, Russell K (2010) Annual Report for the Noble Ellenburg Windpark, LLC: Postconstruction Bird and Bat Fatality Study - 2009. 51. Chatfield A, Erickson WP, Bay K (2010) Final Report: Avian and Bat Fatality Study at the Alite Wind-Energy Facility, Kern County, California. Final Report: June 15, 2009 – June 15, 2010. 52. Western EcoSystems Technology, Inc. (WEST) (2006) Diablo Winds Wildlife Monitoring Progress Report, March 2005 - February 2006. Cheyenne, Wyoming: WEST. 53. Western EcoSystems Technology, Inc. (WEST) (2008) Diablo Winds Wildlife Monitoring Progress Report: March 2005 – February 2007. 54. Chatfield A, Erickson W, Bay K (2009) Avian and Bat Fatality Study, Dillon Wind-Energy Facility, Riverside County, California. Final Report: March 26, 2008 - March 26, 2009. 55. BioResource Consultants, Inc. (BRC) (2010) 2009/2010 Annual Report: Bird and Bat Mortality Monitoring, Pine Tree Wind Farm, Kern County, California. 56. Kerlinger P, Curry R, Culp L, Hasch A, Jain A (2009) Post-Construction Avian Monitoring Study for the Shiloh I Wind Power Project, Solano County, California. Final Report: October 2009. 57. Kerlinger P, Curry R, Culp L, Hasch A, Jain A (2010) Post-Construction Avian Monitoring Study for the Shiloh II Wind Power Project, Solano County, California. Year One Report. 58. Western EcoSystems Technology, Inc. (WEST) (2011) Post-Construction Fatality Surveys for the Barton Chapel Wind Project: Iberdrola Renewables. Version: July 2011. 59. Gruver J, Sonnenberg M, Bay K, Erickson W (2009) Post-Construction Bat and Bird Fatality Study at the Blue Sky Green Field Wind Energy Center, Fond Du Lac County, Wisconsin July 21 - October 31, 2008 and March 15 - June 4, 2009. 60. Tierney R (2007) Buffalo Gap I Wind Farm Avian Mortality Study: February 2006-January 2007. 61. Tierney R (2009) Buffalo Gap 2 Wind Farm Avian Mortality Study: July 2007 - December 2008. Final Survey Report. 62. Johnson GD, Erickson WP, Strickland MD, Shepherd MF, Shepherd DA (2000) Avian Monitoring Studies at the Buffalo Ridge Wind Resource Area, Minnesota: Results of a 4-Year Study. 212 pp. 63. Derby C, Chodachek K, Bay K, Merrill A (2010) Post-Construction Fatality Survey for the Buffalo Ridge I Wind Project. May 2009 - May 2010. 64. Derby C, Chodachek K, Sonnenberg M (2012) Post-Construction Casualty Surveys for the Buffalo Ridge II Wind Project. Iberdrola Renewables: March 2011- February 2012. 65. BHE Environmental, Inc. (BHE) (2010) Post-Construction Bird and Bat Mortality Study: Cedar Ridge Wind Farm, Fond Du Lac County, Wisconsin. 66. BHE Environmental, Inc. (BHE) (2011) Post-Construction Bird and Bat Mortality Study: Cedar Ridge Wind Farm, Fond Du Lac County, Wisconsin. 67. Derby C, Chodachek K, Bay K, Merrill A (2010) Post-Construction Fatality Surveys for the Elm Creek Wind Project: March 2009- February 2010. 68. Derby C, Chodachek K, Sonnenberg M (2012) Post-Construction Fatality Surveys for the Elm Creek II Wind Project. Iberdrola Renewables: March 2011-February 2012. 69. Derby C, Ritzert J, Bay K (2010) Bird and Bat Fatality Study, Grand Ridge Wind Resource Area, Lasalle County, Illinois. January 2009 - January 2010. 70. Derby C, Dahl A, Erickson W, Bay K, Hoban J (2007) Post-Construction Monitoring Report for Avian and Bat Mortality at the NPPD Ainsworth Wind Farm. Unpublished report prepared by Western EcoSystems Technology, Inc. (WEST), Cheyenne, Wyoming, for the Nebraska Public Power District. 71. Derby C, Dahl A, Merrill A (2012) Post-Construction Monitoring Results for the PrairieWinds SD1 Wind Energy Facility, South Dakota. Final Report: March 2011 - February 2012. 72. Derby C, Chodachek K, Bay K, Nomani S (2011) Post-Construction Fatality Surveys for the Rugby Wind Project: Iberdrola Renewables, Inc. March 2010 - March 2011. 73. Derby C, Dahl A, Merrill A, Bay K (2010) 2009 Post-Construction Monitoring Results for the Wessington Springs Wind-Energy Facility, South Dakota. Final Report. 74. Derby C, Dahl A, Bay K, McManus L (2011) 2010 Post-Construction Monitoring Results for the Wessington Springs Wind Energy Facility, South Dakota. Final Report: March 9 – November 16, 2010. 75. Derby C, Chodachek K, Bay K, Merrill A (2010) Post-Construction Fatality Surveys for the Winnebago Wind Project: March 2009- February 2010. 76. Nicholson CP, R.D. Tankersley J, Fiedler JK, Nicholas NS (2005) Assessment and Prediction of Bird and Bat Mortality at Wind Energy Facilities in the Southeastern United States. 77. Fiedler JK, Henry TH, Tankersley RD, Nicholson CP (2007) Results of Bat and Bird Mortality Monitoring at the Expanded Buffalo Mountain Windfarm, 2005. 78. Arnett EB, Schirmacher MR, Huso MMP, Hayes JP (2009) Effectiveness of Changing Wind Turbine Cut-in Speed to Reduce Bat Fatalities at Wind Facilities: 2008 Annual Report. 79. Arnett EB, Schirmacher MR, Huso MMP, Hayes JP (2010) Patterns of Bat Fatality at the Casselman Wind Project in South-Central Pennsylvania. 80. Stantec Consulting, Inc. (Stantec) (2010) Cohocton and Dutch Hill Wind Farms Year 1 Post-Construction Monitoring Report, 2009, for the Cohocton and Dutch Hill Wind Farms in Cohocton, New York. 81. Stantec Consulting, Inc. (Stantec) (2011) Cohocton and Dutch Hill Wind Farms Year 2 Post-Construction Monitoring Report, 2010, for the Cohocton and Dutch Hill Wind Farms in Cohocton, New York. 82. Arnett EB, Schirmacher MR, Hein CD, Huso MMP (2011) Patterns of Bird and Bat Fatality at the Locust Ridge II Wind Project, Pennsylvania. 2009-2010 Final Report. 83. Kerns J, Kerlinger P (2004) A Study of Bird and Bat Collisions at the Mountaineer Wind Energy Facility, Tucker County, West Virginia: Annual Report for 2003. Technical report prepared by Curry and Kerlinger, LLC., for FPL Energy and Mountaineer Wind Energy Center Technical Review Committee. Curry and Kerlinger, LLC. 39 pp p. 84. Stantec Consulting, Inc. (Stantec) (2009) Post-Construction Monitoring at the Munnsville Wind Farm, New York: 2008. 85. Jacques Whitford Stantec Limited (Jacques Whitford) (2009) Ripley Wind Power Project Postconstruction Monitoring Report. 86. Tidhar D, McManus L, Courage Z, Tidhar WL (2012) 2010 Post-Construction Fatality Monitoring Study and Bat Acoustic Study for the High Sheldon Wind Farm, Wyoming County, New York. Final Report: April 15 - November 15, 2010. 87. Tidhar D, McManus L, Solick D, Courage Z, Bay K (2012) 2011 Post-Construction Fatality Monitoring Study and Bat Acoustic Study for the High Sheldon Wind Farm, Wyoming County, New York. Final Report: April 15 - November 15, 2011. 88. Kronner K, Gritski R, Downes S (2008) Big Horn Wind Power Project Wildlife Fatality Monitoring Study: 2006−2007. 89. Downes S, Gritski R (2012) Harvest Wind Project Wildlife Monitoring Report: January 2010 – January 2012. 90. Gritski R, Kronner K, Downes S (2008) Leaning Juniper Wind Power Project, 2006 − 2008. Wildlife Monitoring Final Report. 91. Gritski R, Kronner K (2010) Pebble Springs Wind Power Project Wildlife Monitoring Study: January 2009 January 2010. 92. Brown WK, Hamilton BL (2006) Monitoring of Bird and Bat Collisions with Wind Turbines at the Summerview Wind Power Project, Alberta: 2005-2006. 93. Enz T, Bay K (2010) Post-Construction Avian and Bat Fatality Monitoring Study, Tuolumne Wind Project, Klickitat County, Washington. Final Report: April 20, 2009 - April 7, 2010. 94. Downes S, Gritski R (2012) White Creek Wind I Wildlife Monitoring Report: November 2007 - November 2011. 95. Tidhar D, Tidhar W, Sonnenberg M (2010) Post-Construction Fatality Surveys for Lempster Wind Project, Iberdrola Renewables. Prepared for Lempster Wind, LLC, Lempster Wind Technical Advisory Committee, and Iberdrola Renewables, Inc. 96. Stantec Consulting, Inc. (Stantec) (2008) 2007 Spring, Summer, and Fall Post-Construction Bird and Bat Mortality Study at the Mars Hill Wind Farm, Maine. 97. Stantec Consulting, Inc. (Stantec) (2009) Post-Construction Monitoring at the Mars Hill Wind Farm, Maine Year 2, 2008. 98. Stantec Consulting, Inc. (Stantec) (2009) Stetson I Mountain Wind Project: Year 1 Post-Construction Monitoring Report, 2009 for the Stetson Mountain Wind Project in Penobscot and Washington Counties, Maine. 99. Normandeau Associates, Inc. (2011) Year 3 Post- Construction Avian and Bat Casualty Monitoring at the Stetson I Wind Farm, T8 R4 NBPP, Maine. 100. Normandeau Associates, Inc. (2010) Stetson Mountain II Wind Project Year 1 Post-Construction Avian and Bat Mortality Monitoring Study, T8 R4 NBPP, Maine. 101. Kerlinger P, Curry R, Culp L, Jain A, Wilkerson C, et al. (2006) Post-Construction Avian and Bat Fatality Monitoring for the High Winds Wind Power Project, Solano County, California: Two Year Report. 102. Derby C, Chodachek K, Bay K, Nomani S (2011) Post-Construction Fatality Surveys for the Barton I and II Wind Project: IRI. March 2010 - February 2011. 103. Howe RW, Evans W, Wolf AT (2002) Effects of Wind Turbines on Birds and Bats in Northeastern Wisconsin. 104 pp p. 104. Derby C, Chodachek K, Bay K, Merrill A (2010) Post-Construction Fatality Surveys for the Moraine II Wind Project: March - December 2009. 105. Chodachek K, Derby C, Sonnenberg M, Thorn T (2012) Post-Construction Fatality Surveys for the Pioneer Prairie Wind Farm I LLC Phase II, Mitchell County, Iowa: April 4, 2011 – March 31, 2012. 106. Derby C, Chodachek K, Thorn T, Bay K, Nomani S (2011) Post-Construction Fatality Surveys for the PrairieWinds ND1 Wind Facility, Basin Electric Power Cooperative, March - November 2010. 107. Derby C, Chodachek K, Thorn T, Merrill A (2012) Post-Construction Surveys for the PrairieWinds ND1 (2011) Wind Facility Basin Electric Power Cooperative: March - October 2011. 108. Jain A (2005) Bird and Bat Behavior and Mortality at a Northern Iowa Windfarm. Thesis. Ames, Iowa: Iowa State University.
